
i
Water Research Commission
Submitted to:
Dr Gerhard BackebergSylvester Mpandeli
Executive Manager: Water Utilisation in Agriculture
Water Research Commission
Pretoria
Prepared By:
Project team led by Mahlathini Development Foundation.
2nd Progress Report:
2018-2019
3rd Reference Group
Meeting
Project Number: K5/2719/4
Project Title: Collaborative knowledge creation and mediation strategies for the dissemination of
Water and Soil Conservation practices and ClimateSmart Agriculture in smallholder farming systems.
Reference group Meeting: 3rd Progress and planning report
Date: May 2019

2
Submitted to:
Executive Manager: Water Utilisation in Agriculture
Water Research Commission
Pretoria
Project team:
Mahlathini Development Foundation
Erna Kruger
Mazwi Dlamini
Temakholo Mathebula
Samukhelisiwe Mkhize
Institute of Natural Resources NPC
Jon McCosh
Rural Integrated Engineering (Pty) Ltd
Christiaan Stymie
Rhodes University Environmental Learning Research Centre
Lawrence Sisitka

3
CONTENTS
FIGURES 4
TABLES 4
1Progress summary6
1.1 Project aims6
1.2 Deliverables6
1.3 Overview of activities7
2. CoPs and demonstration sites established9
3. CSA practices implemented10
3.1 KwaZulu Natal10
3.2 LImpopo12
3.3 Eastern Cape14
4. The Decision Support System15
4.1 How does the facilitator-farmer DSS work18
4.2 Refinement of the Individual DSS Model19
Practices recommended (Round 1) for 26 HH20
Refinement of the DSS model (Version 2)21
Ranking of suggested practices based on score provided by the facilitator24
Ranking of suggested practices based on score provided by the farmer25
5. Participatory impact assessment (PIA)26
5.1 PIA Workshop outline26
5.2 Participatory Impact assessment; Bergville, Ntabamhlophe (April 2019)29
Attendance 29
Climate change29
Climate change impacts on farming and livelihoods29
CSA practices31
Changes and benefits from CSA practices33
Expanding on CSA practices36
Evaluation of the workshop37
6. Resilience snapshots37
6.1 Resilience snapshot case study for KZN37
Learning and change37
Climate smart practices38
6.2 Resilience snapshot40
7. Quantitative measurements43
7.1 Water Productivity in Conservation Agriculture45
Water Productivity results and discussion; Method 148
7.2 Water productivity for gardening systems51
Cost-benefit analysis for the Gardening systems in Limpopo and KZN52
7.3 Visual /Qualitative Assessments54
Piloting of the new VSA methodology.55
8. Work Plan57
9. Capacity building59
9.1Community level learning59
9.2Organisational capacity building59
9.3 Post graduate students59
Progress with theses: Field work and initial reporting60
Progress: Initial proposals and research methodology60
10. Publications and networking60
Publications 60

4
Cross visits60
Attendance 60
Presentations 61
Awards 61
FIGURES
Figure 1: The Small- Scale Farmer Decision Support System .................................................................................................16
Figure 2: The computer- based model for the smallholder DSS.............................................................................................17
Figure 3: Resources to manage and their associated management strategies......................................................................18
Figure 4: A systemic view of the Facilitator-Farmer DSS indicating associated activities and processes.............................19
Figure 5: Social learning, innovation and building agency is an iterative process that includes careful monitoring and
evaluation................................................................................................................................................................................19
Figure 6: Water productivity results using weather station data for dryland field cropping using CA.................................48
Figure 7: Biomass water productivity results using weather station data for dryland field cropping using CA...................50
TABLES
Table 1: Summary of activities related to deliverables and outputs......................................................................7
Table 2: CoPs’ established in three provinces (October 2018-January 2019)........................................................9
Table 3: CSA practices implemented in KZN 2017-2016.......................................................................................11
Table 4: CSA practices implemented in Limpopo 2017-2016...............................................................................12
Table 5: CSA practices implemented in the Eastern Cape 2017-2016..................................................................14
Table 6:Criteria to define the resources to manage and related strategies (version 1) ....................................20
Table 7: Criteria to define the resources to manage and related strategies (version 2)...................................21
Table 8: Basket/list of practices recommended for version 1 and 2 of the DSS ................................................22
Table 9: Ranking of suggested practices by ‘the facilitator’ for Phumelele Hlongwane (DSS version 2)..........25
Table 10: Analysis of CSA practices implemented in KZN (Bergville, Tabamhlophe) –2017-2019 ...................25
Table 11: Impacts of practices according to livelihoods resrources.....................................................................30
Table 12:CSA practices implemented in Bergville and Nthabamhlophe..............................................................32
Table 13:Impact indicators and assessment form the Bergville PIA, April 2019 ..................................................34
Table 14: CSA practices still to be tried out in Bergville:2019-2020.....................................................................36
Table 15: Participants in quantitative measurements for trials; KZN and Limpopo..........................................44
Table 16: Measurements taken for the gardening trials....................................................................................44
Table 17: Measurements taken for the field cropping trials ..............................................................................44
Table 18: Table outlining rotations undertaken in Phumelele’s trial andcontrol plots over the last three
seasons, including an indication of installation of runoff plots.........................................................................46
Table 19: Maize yields per plot in Phumelele Hlongwane’s rotation system:2015-2017 ....................49
Table 20: Water productivity for gardening practices for two participants from Bergville; July-Aug 2018......51
Table 21: Water productivity for gardening practices for two participants from Limpopo (Sedawa); April -July
2018......................................................................................................................................................................51
Table 22: New redesigned VSA Indicator sheet for 2018....................................................................................54
Table 23: VSA scores using the new methodology for 5 participants in Stulwane, November 2018................56
Table 24: Work plan for 2019-2021......................................................................................................................57

5
ProgressReport(K5/2719/4)–May 2019
DEFINITIONS OF TERMS USED IN THIS REPORT
Climate Smart Agriculture:
CSA ‘…contributes to the achievement of sustainable development goals. It integrates the three
dimensions of sustainable development (economic, social and environmental) by jointly addressing
food security and climate challenges. It is composed of three main pillars:
1. Sustainably increasing agricultural productivity and incomes,
2. Adapting and building resilience to climate change and
3. Reducing and/or removing greenhouse gases emissions, where possible. (FAO, 2013
1
)
Climate Change:
There is ample evidence of national and local changes in the temperature and rainfall climatology of
South Africa over at least the past five decadesand a high probability that this process may increase
in the coming decades:
•Mean annual temperatures have increased by more than1.5 times the observed global average
of 0.65°C,
•Maximum and minimum temperatures have been increasing annually and in almost all seasons,
•Hot and cold extremes have increased and decreased respectively in frequency, in most seasons
across the country, particularly in the western and northern interior,
•In almost all hydrological zones there has been a marginal reduction in rainfall for the autumn
months. Annual rainfall has not changed significantly, but an overall reduction in the number of
rain days implies a tendency towards an increase in the intensity of rainfall events and increased
dry spell duration and
•Extreme rainfall events show a tendency towards increasing in frequency annually, and especially
in spring and summer, with a reduction in extremes in autumn. (DEA, 2013
2
)
Climate variability:
This term is used when community members indicate that there have been changes in their weather
patterns, but where the trends are not necessarily clear. It includes and increased in extreme events
such as storms, wind, and in season dry spells. It also includes and increased in drought conditions and
variability in temperature, where temperatures are consideredhigher (orlower) then “normal”in a
given month or season.
Resilience:
1
FAO, 2013. Climate Smart Agriculture Sourcebook. Food and Agriculture Organization of the United
Nations. 2013
2
DEA (Department of Environmental Affairs). 2013. Long-Term AdaptationScenarios Flagship
Research Programme (LTAS) for South Africa. Summary for Policy-Makers. Pretoria, South Africa.

6
Resilience is the ability of a system to anticipate, absorb, accommodate or recover from the effects of
an extreme climate event in a timely and efficient manner.
Contextual vulnerability is locally focussedand considers the presentas the departure point and
considers socio-economic dimensions of vulnerability as a basis for assessing future vulnerability. This
is largely a participatory process as opposed to modelling approaches that are applied at programme
and policy scales. Vulnerability and adaptation needs are contextualisedwith the local context and
will include factors that aren’t necessarily directly linked to climate change or CSA(FAO, 2013).
1Progress summary
1.1 Project aims
1. To evaluate and identify best practice options for CSA and Soil and Water Conservation
(SWC) in smallholder farming systems, in two bioclimatic regions in South Africa. (Output 1)
2. To amplify collaborative knowledge creation of CSA practices with smallholder farmers in
South Africa (Output 2)
3. To test and adapt existing CSA decision support systems (DSS) for the South African smallholder
context (Outputs 2,3)
4. To evaluate the impact of CSA interventions identified through the DSS by piloting interventions
in smallholder farmer systems, considering water productivity, social acceptability and farm-scale
resilience (Outputs 3,4)
5. Visual and proxy indicators appropriate for a Paymentfor Ecosystems based model are tested at
community level for local assessment of progress and tested against field and laboratory analysis
of soil physical and chemical properties, and water productivity (Output 5)
1.2 Deliverables
No
Deliverable
Description
Target date
FINANCIAL YEAR 2017/2018
1
Report: Desktop review of
CSA and WSC
Desktop review of current science, indigenous and traditional
knowledge, and best practice in relation to CSA and WSC in the
South African context
1 June 2017
COMPLETE
2
Report on stakeholder
engagement and case
study development and
site identification
Identifying and engaging with projects and stakeholders
implementing CSA and WSC processes and capturing case studies
applicable to prioritized bioclimatic regions
Identification of pilot research sites
1 September
2017
COMPLETE
3
Decision support system
for CSA in smallholder
farming developed
(Report)
Decision support system for prioritization of best bet CSA options in
a particular locality; initial database and models. Review existing
models, in conjunction with stakeholder discussions for initial
criteria
15 January
2018
COMPLETE
FINANCIAL YEAR: 2018/2019
4
CoPs and demonstration
sites established (report)
Establish communities of practice (CoP)s including stakeholders and
smallholder farmers in each bioclimatic region.5. With each CoP,
identify and select demonstration sites in each bioclimatic region
and pilot chosen collaborative strategies for introduction of a range
of CSA and WSC strategies in homestead farming systems (gardens
and fields)
1 May 2018
COMPLETE
5
Interim report: Refined
decision support system
for CSA in smallholder
farming (report)
Refinement of criteria and practices, introduction of new ideas and
innovations, updating of decision support system
1 October
2018
COMPLETE
6
Interim report: Results of
pilots, season 1
Pilot chosen collaborative strategies for introduction of a range of
CSA and WSC strategies, working with the CoPs in each site and the
decisions support system. Create knowledge mediation productions,
31 January
2019
COMPLETE

7
manuals, handouts and other resources necessary for learning and
implementation.
FINANCIAL YEAR 2019/2020
7
Report: Appropriate
quantitative measurement
procedures for verification
of the visual indicators.
Set up farmer and researcher level experimentation
1 May 2019
COMPLETE
8
Interim report:
Development of indicators,
proxies and benchmarks
and knowledge mediation
processes
Document and record appropriate visual indicators and proxies for
community level assessment, work with CoPs to implement and
refine indicators. Link proxies and benchmarks to quantitative
research to verify and formalise. Explore potential incentive
schemes and financing mechanisms.
Analysis of contemporary approaches to collaborative knowledge
creation within the agricultural sector. Conduct survey of present
knowledge mediation processes in community and smallholder
settings. Develop appropriate knowledge mediation processes for
each CoP. Develop CoP decision support systems
1 August
2019
9
Interim report: results of
pilots, season 2
Pilot chosen collaborative strategies for introduction of a range of
CSA and WSC strategies, working with the CoPs in each site and the
decisions support system. Create knowledge mediation productions,
manuals, handouts and other resources necessary for learning and
implementation.
31 January
2020
FINANCIAL YEAR 2020/2021
10
Final report: Results of
pilots, season
Pilot chosen collaborative strategies for introduction of a range of
CSA and WSC strategies, working with the CoPs in each site and the
decisions support system. Create knowledge mediation productions,
manuals, handouts and other resources necessary for learning and
implementation.
1 May 2020
11
Final Report: Consolidation
and finalisation of decision
support system
Finalisation of criteria and practices, introduction of new ideas and
innovations, updating of decision support system
3 July 2020
12
Final report - Summarise
and disseminate
recommendations for best
practice options.
Summarise and disseminate recommendations for best practice
options for knowledge mediation and CSA and SWC techniques for
prioritized bioclimatic regions
7 August
2020
Deliverables 5,6 and 7 were undertaken in this reporting period
1.3 Overview of activities
The design of the decision support system is seen as an ongoing process divided into three
distinct parts:
➢Practices: Collation, review, testing, and finalisation of those CSA practices to be
included. Allows for new ideas and local practices to be included over time. This
also includes linkages and reference to external sources of technical information
around climate change, soils, water management etc and how this will be done;
➢Process: Through which climate smart agricultural practices are implemented at
smallholder farmer level. This also includes the facilitation component,
communities of practice, communication strategies and capacity building and
➢Monitoring and evaluation: local and visual assessment protocols for assessing
implementation and impact of practices as well as processes used. This also
includes site selection and quantitative measurements undertaken to support the
visual assessment protocols and development of visual and proxy indicators for
future use in inactive based support schemes for smallholder farmers
The table below provides a summary of progress towards outputs
Table 1: Summary of activities related to deliverables and outputs

8
Deliverable 4
Deliverable 5
Deliverable 6
Deliverable 7
Practices
Output 1
CSA practices
summary updated
Agroforestry and
livestock
management
practices
included
1st round water
productivity (wp)
assessments:
gardening
1st round wp, soil
health run-off,
assessments; field
cropping (CA)
1st round
community level
resilience snapshots
Process
Outputs
2,3
-CCA workshop 1
(2 villages –EC,
KZN
-CCA workshop
1 (2 villages –
EC, KZN
-CCA workshop 1
(2 villages –EC,
KZN
-CCA workshop 1
(2 villages –EC,
KZN
-Collaborative
activities
-Collaborative
activities
-Collaborative
activities
-Collaborative
activities
-CCA workshop 2
(3 villages EC,
KZN)
CCA workshop 2
(1 village KZN, 2
villages
Limpopo, 3
villages EC)
CCA workshop 2 (2
villages KZN)
-CCA workshops
(1 village KZN, 1
village Limpopo)
-CCA workshops 3-
5
(3 villages EC, 2
villages KZN, 1
village Limpopo)
-CCA workshops 3-
5 (1 village KZN)
-Individual
experimentation
Individual
experimentation
Individual
experimentation
Individual
experimentation
CoPs established
and meeting
Food security learning
groups–4 (LimaRDF,
MDF)
CA learning groups-2
(MDF/AWARD)
CA networking
platforms KZN;
(GrainSA/MDF/
KwaNalu/ LMs)
Agroecology
networking;
AWARD/MDF
Continuation of
CoPs;
FS learning
groups x 7
CA networking
platforms
Agroecology
network
Amanzi 4 Food
Network
New CoPs –2 new learning groups SKZN
FS learning groups x9
CA learning groups x 5
CA networking platforms
Agroecology network
Amanzi 4 Food Network
DSS –1st iteration
Modelling process
1st iteration (version
1
Modelling process-
refined (version 2)
-Quantitative
measurement
-Quantitative measurement sites set up; CA, gardening
9
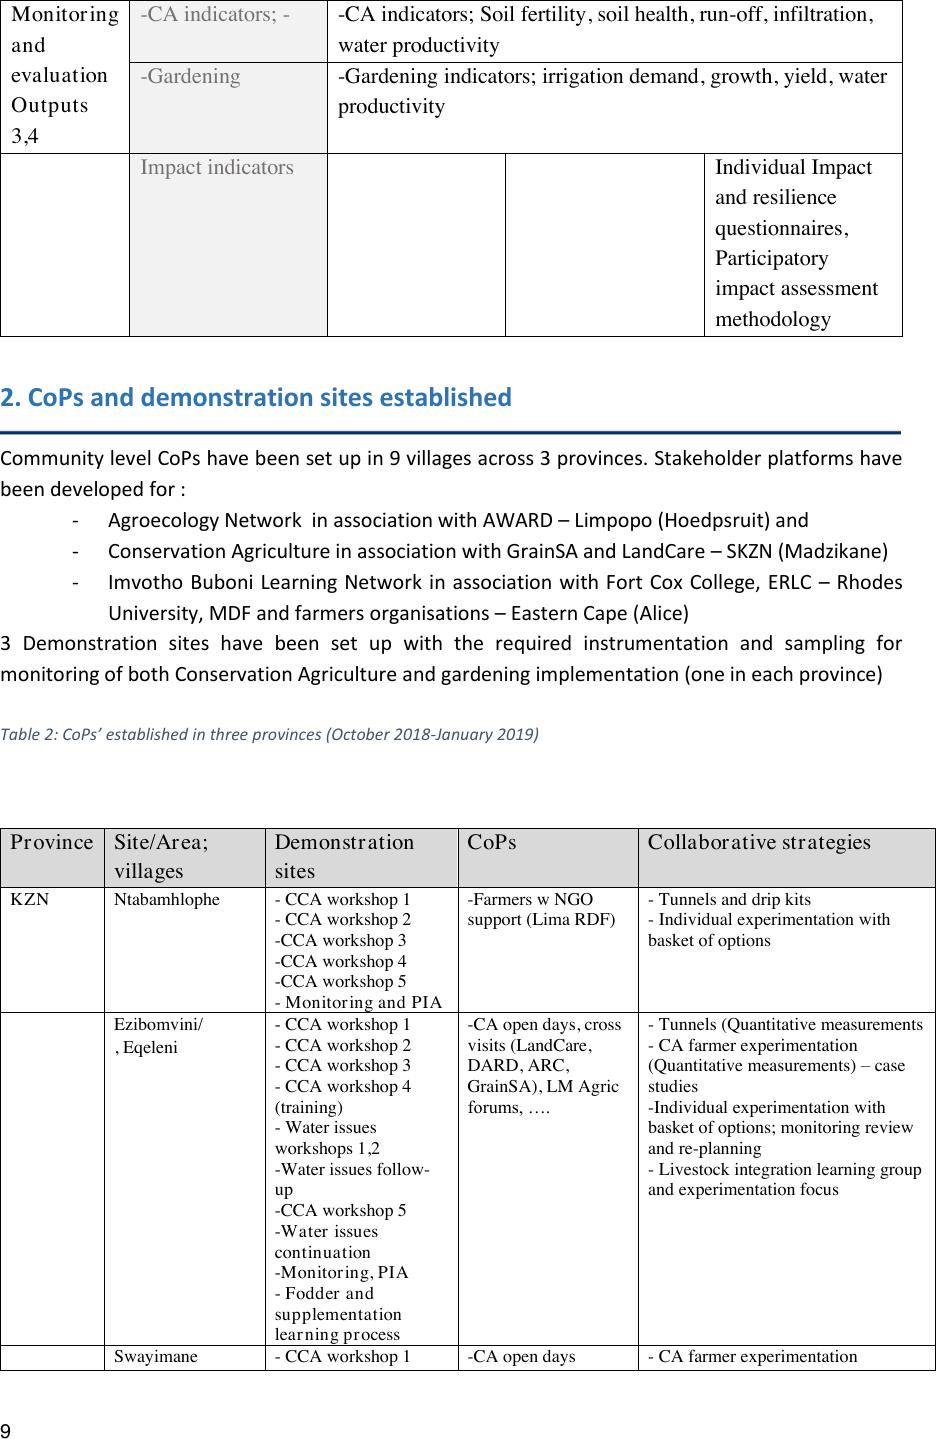
Monitoring
and
evaluation
Outputs
3,4
-CA indicators; -
-CA indicators; Soil fertility, soil health, run-off, infiltration,
water productivity
-Gardening
-Gardening indicators; irrigation demand, growth, yield, water
productivity
Impact indicators
Individual Impact
and resilience
questionnaires,
Participatory
impact assessment
methodology
2. CoPs and demonstration sites established
Community level CoPs have been set up in 9 villages across 3provinces. Stakeholder platforms have
been developed for :
-Agroecology Network in association with AWARD –Limpopo (Hoedpsruit) and
-Conservation Agriculture in association with GrainSA and LandCare –SKZN (Madzikane)
-Imvotho Buboni Learning Network in association with Fort Cox College, ERLC –Rhodes
University, MDF and farmers organisations –Eastern Cape (Alice)
3 Demonstration sites have been set up with the required instrumentation and sampling for
monitoring of both Conservation Agriculture and gardening implementation (one in each province)
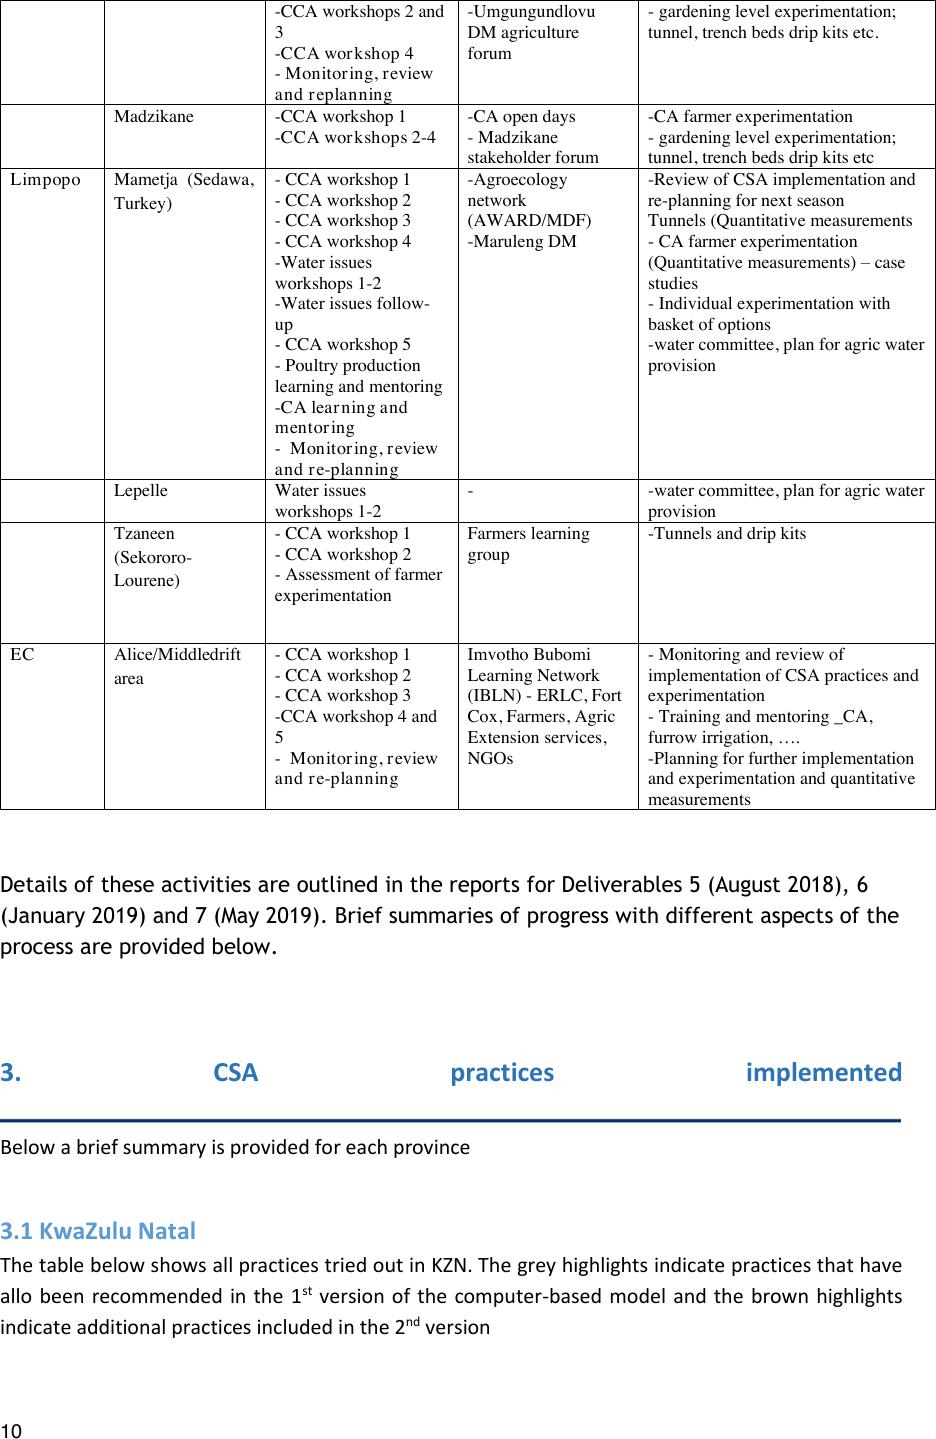
Table 2: CoPs’ established in three provinces (October 2018-January 2019)
Province
Site/Area;
villages
Demonstration
sites
CoPs
Collaborative strategies
KZN
Ntabamhlophe
-CCA workshop 1
-CCA workshop 2
-CCA workshop 3
-CCA workshop 4
-CCA workshop 5
-Monitoring and PIA
-Farmers w NGO
support (Lima RDF)
-Tunnels and drip kits
-Individual experimentation with
basket of options
Ezibomvini/
, Eqeleni
-CCA workshop 1
-CCA workshop 2
-CCA workshop 3
-CCA workshop 4
(training)
-Water issues
workshops 1,2
-Water issues follow-
up
-CCA workshop 5
-Water issues
continuation
-Monitoring, PIA
-Fodder and
supplementation
learning process
-CA open days, cross
visits (LandCare,
DARD, ARC,
GrainSA), LM Agric
forums, ….
-Tunnels (Quantitative measurements
-CA farmer experimentation
(Quantitative measurements) –case
studies
-Individual experimentation with
basket of options; monitoring review
and re-planning
-Livestock integration learning group
and experimentation focus
Swayimane
-CCA workshop 1
-CA open days
-CA farmer experimentation
10
Details of these activities are outlined in the reports for Deliverables 5 (August 2018), 6
(January 2019) and 7 (May 2019). Brief summaries of progress with different aspects of the
process are provided below.
3. CSA practices implemented
Below a brief summary is provided for each province
3.1 KwaZulu Natal
The table below shows allpractices tried out in KZN. The grey highlights indicate practices that have
allo been recommended in the 1st version of the computer-based model and the brown highlights
indicate additional practices included in the 2nd version
-CCA workshops 2 and
3
-CCA workshop 4
-Monitoring, review
and replanning
-Umgungundlovu
DM agriculture
forum
-gardening level experimentation;
tunnel, trench beds drip kits etc.
Madzikane
-CCA workshop 1
-CCA workshops 2-4
-CA open days
-Madzikane
stakeholder forum
-CA farmer experimentation
-gardening level experimentation;
tunnel, trench beds drip kits etc
Limpopo
Mametja (Sedawa,
Turkey)
-CCA workshop 1
-CCA workshop 2
-CCA workshop 3
-CCA workshop 4
-Water issues
workshops 1-2
-Water issues follow-
up
-CCA workshop 5
-Poultry production
learning and mentoring
-CA learning and
mentoring
-Monitoring, review
and re-planning
-Agroecology
network
(AWARD/MDF)
-Maruleng DM
-Review of CSA implementation and
re-planning for next season
Tunnels (Quantitative measurements
-CA farmer experimentation
(Quantitative measurements) –case
studies
-Individual experimentation with
basket of options
-water committee, plan for agric water
provision
Lepelle
Water issues
workshops 1-2
-
-water committee, plan for agric water
provision
Tzaneen
(Sekororo-
Lourene)
-CCA workshop 1
-CCA workshop 2
-Assessment of farmer
experimentation
Farmers learning
group
-Tunnels and drip kits
EC
Alice/Middledrift
area
-CCA workshop 1
-CCA workshop 2
-CCA workshop 3
-CCA workshop 4 and
5
-Monitoring, review
and re-planning
Imvotho Bubomi
Learning Network
(IBLN) -ERLC, Fort
Cox, Farmers, Agric
Extension services,
NGOs
-Monitoring and review of
implementation of CSA practices and
experimentation
-Training and mentoring _CA,
furrow irrigation, ….
-Planning for further implementation
and experimentation and quantitative
measurements

11
Table 3: CSA practices implemented in KZN 2017-2016
Soil
Water
Crop (garden and
field)
Livestock
Natural
Resources
People
Making
compost
Drip irrigation
Diversified crops
in gardens;
beetroot, Chinese
cabbage, carrots,
parsley, thyme,
Vaccinations
Savings
Use of
goat and
cattle
manure
Mulching
Shade cloth
tunnels
Dipping
Small
businesses
Canopy
cover and
legumes
(Lab-Lab)
Infiltration pits
Beds: raised beds,
trench beds, eco-
circles
Proper feed;
including
from fodder
produced
Farmer
centres
Diversified
crops to
hold soil
and
prevent
erosion
Garden layout with
shallow furrows for
water harvesting and
retention
Tower gardens –
fertility and
greywater
management
Addition of
supplements
Selling
chickens
Greywater
management
Conservation
agriculture;
including
management of
residues
Limiting
burning of
veld
Improved irrigation
practices
Inter cropping and
crop rotation
Planting
grass;
ungwengwe
and kikuyu
Rainwater storage in
JoJo tanks and drums
Diversified crops
in fields; different
varieties of maize,
sorghum, millet,
legumes (e.g.
cowpeas, beans,
Lab-lab), cover
crops
Spring protection
Use of Decis Forte
(Pyrethrins) for
pest control in
fields
Buying JoJo tanks –and
negotiating with water
trucks to fill these
Liquid manure
Mixed cropping in
gardens

12
The photographs below provide a visual indication of these practice
1: Tower garden; using greywater for irrigation, planted to kale, spinach and tomatoes
2: Eco-circle with a 2litre bottle (with holes) used for in situ irrigation and planted to a mixture of herbs
and vegetables
3: Bucket drip kits inside a shade cloth tunnel
4: raised bed with mixed cropping planted as a “normal practice control” when comparing with trench
beds
5: A Shade cloth tunnel with 3 5x1m trench - beds
6: Inspection of a locally protected spring
7: A shallow trench bed planted to a mixture of green peppers, chillies and marigolds
8: A deep trench bed planted to a mixture of kale, rape, mustard spinach and Chinese cabbage
9: A maize and cowpea intercropped conservation agriculture (CA) plot
10: A CA plot planted to summer cover crops; sunflower, millet and sunnhemp
11: A CA plot planted to Dolichos beans
12: Making bales of hay with a small manual baler
3.2 LImpopo
The table below shows all practices tried out in LImpopo.
Table 4: CSA practices implemented in Limpopo 2017-2016
Soil
Water
Crop (garden and
field)
Livestock
Natural
Resources
People
Making
compost
Drip irrigation
Diversified crops
in gardens;herbs
Planting
fodder
Homestead
nurseries
Water
committees;
2
3
4
5
6
7
8
9
10
11
12
1

13
(coriander,
parsley, basil,
rocket, time,
rosemary) and
vegetables; kale,
rape, mustard
spinach, leeks,
baby marrows,
crops;
ryegrass,
summer
cover crops,
Lucerne
for
installation
of boreholes
Use of goat
and cattle
manure
Mulching
Shade cloth
tunnels
Small
livestock
integration
and feed
production
Organic
mango
production
Organic
marketing
initiative for
sale of herbs
and
vegetables
Canopy cover
and legumes
(Lab-Lab)
Infiltration pits,
banana circles
Beds: raised
beds, trench
beds, eco-circles
Diversified
crops to hold
soil and
prevent
erosion
Garden layout
with shallow
furrows for water
harvesting and
retention
Tower gardens –
fertility and
greywater
management
Greywater
management
Conservation
agriculture;
including
management of
residues
Improved
irrigation
practices
Inter cropping
and crop rotation
Rainwater storage
in JoJo tanks and
drums
Diversified crops
in fields;
different
varieties of
maize, sorghum,
millet, legumes
(e.g. cowpeas,
beans), cover
crops
Underground
RWH tanks
Liquid manure
Mixed cropping
in gardens
The photographs below provide a visual indication of these practice
1
2
3
4
5

14
1: Tower garden for use of greywater for irrigation planted to spinach
2: Diversion ditch leading to large underground rainwater harvesting storage structure (24 000l)
3: Shade cloth tunnel
4: Mixed crop bed; with maize, rape, basil and cassava
5: Ryegrass planted for fodder, being grazed by a small goat
6: Bucket drip kit, irrigating a trench bed which is planted to a mixture of vegetables and mulched
7: A stone line
8: Three 5x1m deep trench beds planted to a mixture of vegetables
9: A CA plot planted to maize that has been mulched
10: A CA mixed crop plot with maize and sorghum (bird resistant variety)
3.3 Eastern Cape
The table below shows all practices tried out in the Eastern Cape
Table 5: CSA practices implemented in the Eastern Cape 2017-2016
Soil
Water
Crop (garden and field)
Livestock
Natural
Resources
People
Making compost
Drip
irrigation
Diversified crops in
gardens;
A4F
agroecology
network
Use of goat and
cattle manure
Mulching
Shade cloth tunnels
Diversified crops
to hold soil and
prevent erosion
Greywater
management
Beds: trench beds, eco-
circles
Improved
irrigation
practices
Tower gardens –
fertility and greywater
management
Furrow
irrigation
Conservation
agriculture; including
management of
residues
15
Underground
RWH tanks
Diversified crops in
fields; different
varieties of maize,
sorghum, millet,
legumes (e.g. cowpeas,
beans), cover crops
Mixed cropping in
gardens
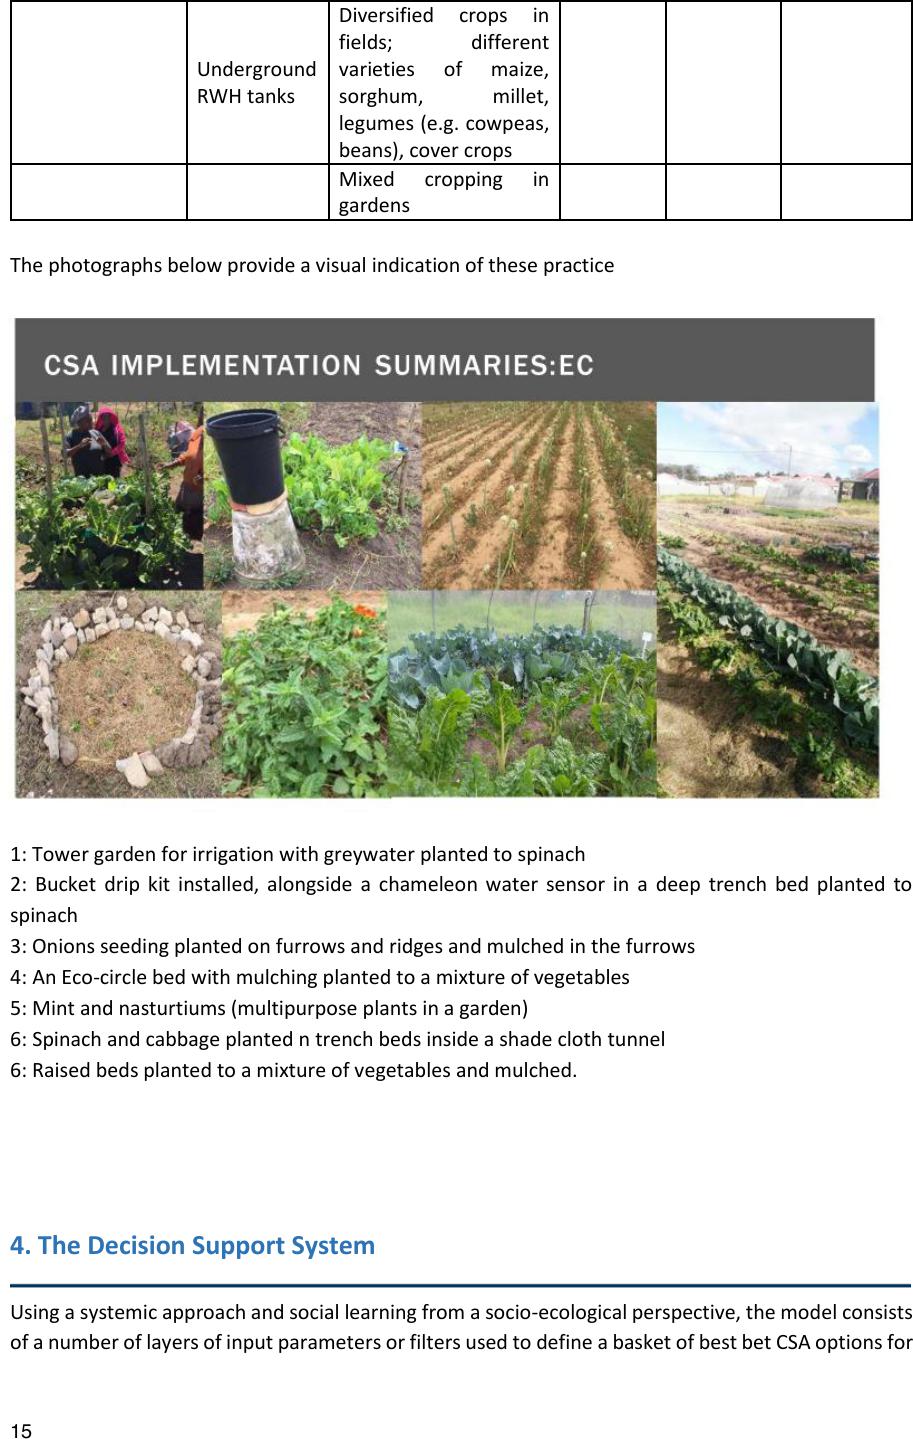
The photographs below provide a visual indication of these practice
1: Tower garden for irrigation with greywater planted to spinach
2: Bucket drip kit installed, alongside a chameleon water sensor in a deep trench bed planted to
spinach
3: Onions seeding planted on furrows and ridges and mulched in the furrows
4: An Eco-circle bed with mulching planted to a mixture of vegetables
5: Mint and nasturtiums (multipurpose plants in a garden)
6: Spinach and cabbage planted n trench beds inside a shade cloth tunnel
6: Raised beds planted to a mixture of vegetables and mulched.
4. The Decision Support System
Using a systemic approach and social learning from a socio-ecological perspective, the model consists
of a number of layers of input parameters or filters used to define a basket of best bet CSA options for
1
2
3
4
5
6
7

16
a specific smallholder farmer, using a combinationof participatory processes linked to technical
databases.
The process is designedto also support and assist the facilitator in their decision making, in support
of the smallholder farmers; meaning that the facilitator accesses information such as the basicclimate
change predictions for the area, the agroecological characteristics including rainfall, temperature, soil
texture etc) and an initial contextualised basket of CSA practices from which to negotiate prioritized
practices with farmers. Practices are thus chosen by both facilitators and farmers.
Figure 1: The Small- Scale Farmer Decision Support System
The model is designed primarily as a participatory and facilitated process at community level. In
support to this process a computer-based model can be used alongside this methodology to provide
further information and decision support to the facilitator. It is also possible for a farmer toaccess this
model independently to derive an initial basket of CSA practice options for themselves.
The computer model information flow is designed as shown in the figure below –and follows the same
basic steps as shown in Figure 1 above.
PHYSICAL ENVIRONMENT: Climate and
geographical parameters; GPS coordinates,
agroecological zones, soil texture, slope and soil
organic carbon content
PRACTICES: Database of CSA practices including; managing available
water, improving access to water, controlling soil movement,
improving soil health and fertility, crop management, integrated crop-
livestock management, veld management and veld rehabilitation

17
Figure 2: The computer- based model for the smallholder DSS
In our case the set of criteria (proxies used as indicators for the complex reality) that helps to make
informed decisions on management practices are:
➢The current farming systems;gardening, field cropping, livestock production and natural
resource management (NRM) (including trees),
➢The physical environment:agroecological zone, soil texture, slope and organicsoil carbon
and
➢The socio-economic background of the farmer;demographic information (gender HH head,
age, dependency ratio), level of education, sources of income (unemployment vs. external
employment, own business, grants, farm, etc.), total income, access to services,
infrastructure, technology (Electricity, water (tap, borehole, rainwater harvesting, etc.),
irrigation (buckets, standpipes, etc.), fencing and farming tools (hand vs traction/other),
social organisation, market access (formal vs. informal), farm size and farming purpose (food
vs. selling).
Besides this, the resources and related management strategies as well as a list of practices need to be
provided as input to the system. All information, except thephysicalenvironment; i.e. climate, soil
and topography, and the resources and management strategies, are derived through the use of a
range of participatory processes.Data on the physical environmental conditions have been taken from
datasets freely available online. This information can however be customised by the DSS user, in case
more appropriate information is available for the specific farmer concerned.
For the Facilitator-Farmer DSS the resources and related management strategies arediscussedand
negotiated in the participatory process. For the computer based or Individual Farmer DSS these are
provided as an input into the model using the following framework:
FARMING SYSTEMFARMER SOCIO-ECONOMIC
BACKGROUND
RESOURCES TO MANAGE
SUGGESTED PRACTICES
CONSTRAINED BY
TYPOLOGY, SYSTEM
AND ENVIRONMENT
RANKED PRACTICES
BASED ON FACILITATORRANKED PRACTICES
BASED ON FARMER
FARMER BASED
PRIORITIES
FACILITATOR
BASED PRIORITIES
PHYSICAL ENVIRONMENT
DSS PROCESS FLOW

18
Figure 3: Resources to manage and their associated management strategies
The practices have been identified by both farmers and experts; the latter based on experience in the
South African context and desktop reviews.
4.1 How does the facilitator-farmer DSS work
In effect, the DSS discussed above is a way of providing and making sense of information. This
information is contextualised in a social learning system (a group of people learning and implementing
together) using the framework shown below.
Local good
practice
CC
Farmer level
experimentation to
test practices (CCA
workshop 4)
CoPs and
innovation
platforms
19
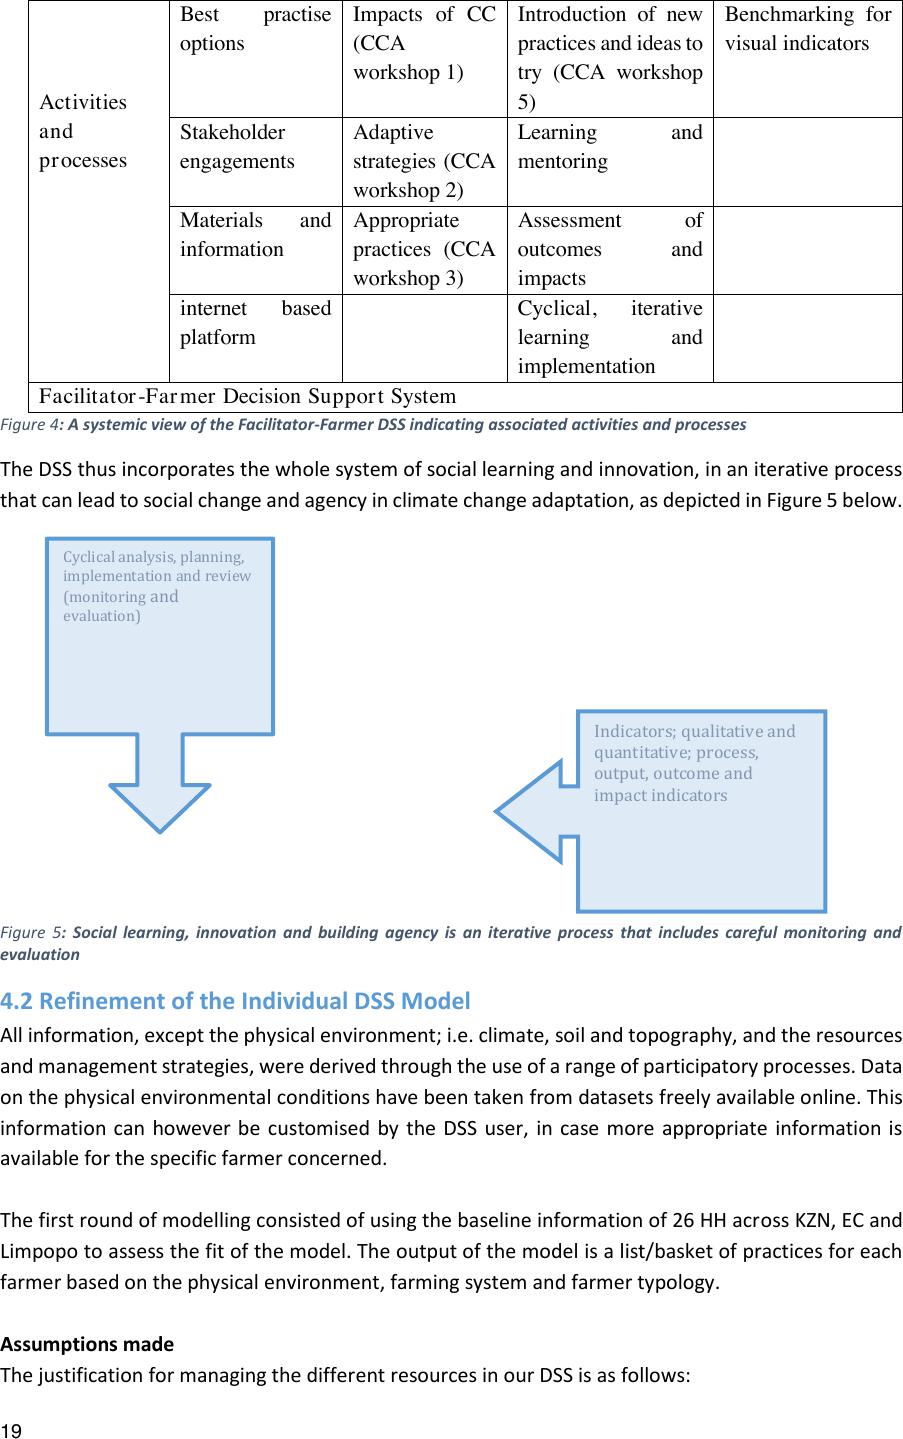
Activities
and
processes
Best practise
options
Impacts of CC
(CCA
workshop 1)
Introduction of new
practices and ideas to
try (CCA workshop
5)
Benchmarking for
visual indicators
Stakeholder
engagements
Adaptive
strategies (CCA
workshop 2)
Learning and
mentoring
Materials and
information
Appropriate
practices (CCA
workshop 3)
Assessment of
outcomes and
impacts
internet based
platform
Cyclical, iterative
learning and
implementation
Facilitator-Farmer Decision Support System
Figure 4: A systemic view of the Facilitator-Farmer DSS indicating associated activities and processes
The DSS thus incorporates the whole system of social learning and innovation, in an iterative process
that can lead to social change and agency in climate change adaptation, as depicted in Figure 5 below.
Figure 5: Social learning, innovation and building agency is an iterative process that includes careful monitoring and
evaluation
4.2 Refinement of the Individual DSS Model
All information, except the physical environment; i.e. climate, soil and topography, and the resources
and management strategies, were derived through the use of a range of participatory processes. Data
on the physical environmental conditions have been taken from datasets freely available online. This
information can however be customised by the DSS user, in case more appropriate information is
available for the specific farmer concerned.
The first round of modelling consisted of using the baseline information of 26 HH across KZN, EC and
Limpopo to assess the fit of the model. The output of the model is a list/basket of practices for each
farmer based on the physical environment, farming system and farmer typology.
Assumptions made
The justification for managing the different resources in our DSS is as follows:
Indicators; qualitative and
quantitative; process,
output, outcome and
impact indicators
Cyclical analysis, planning,
implementation and review
(monitoring and
evaluation)

20
•Semi-arid warm: in this environment water is limited and the temperatures can be hot. Water
and heat stress are the main limiting factors. Pests and diseases in plants and animals are
present.
•Sub-humid cool: in a more humid environment, weeds grow well and can create a competing
environment for nutrients. Plants and animals are also more prone to diseases.
•Sandy soils: those soils have poor structures, with low water and nutrient holding capacity.
They heat up fast. Certain practices are not suitable in sandy soils and more specifically sandy
soils in semi-arid regions, where rainfed crops and trees can be difficult to establish and
maintain.
•Clayey soils: high level of clay can increase the probability of erosion dueto crusting, in
particular undersemi-arid environment. Water and OC retention in clay soils are important
management principles.
•OC: soils with less than 1,5% OC are considered to be of low fertility. %OC in sandy soils is
inherently lower and more difficult to build up than in high clay soils.
•Slope: above 5% sloping, agricultural production becomes sub-optimal due to erosion and run-
off, in both semi-arid and sub-humid regions. Slope above 15%; agricultural production is not
suitable under all conditions, due to water and nutrient run-off.
Table 3 allows us to identify, for each farming HH, the resources to manage and the related strategies
within each farming system taking the environmental conditions into account. It thus combines the
proxies for the physical environment, farming systems and management strategies.
Table 6:Criteria to define the resources to manage and related strategies (version 1)
Note: * (solely in semi-arid zone)
Practices recommended (Round 1) for 26 HH
Based on the above assumptions and proxies a list of practices were recommended for the initial 26
household baseline.These lists have been “reality tested” against the facilitation team’sgeneral

21
experience in the areas. It was found that soil and water conservation practices were under
represented when using this version of the model. This outcome is summarised in the slide below (as
presented at the Agroecology Networking session in December 2018)
Refinement of the DSS model (Version 2)
Three changes have been made:
1. It has been assumed that water (harvesting, retention and use efficiency) is important for all
farmers (thus=1 for all)
2. It has been assumed that soil conservation is important for all farmers (thus=1 for all)
3. Certain restrictions for soil texture and slope have been removed. Water (harvesting,
retention and use efficiency) and soil conservation are no longer restricted to the semi-arid
zone only, as was the case in the first round.
Note:These three changes have been made based on the experience of the project team in the field
and in rural areas across South Africa. Lack of access to water is a very real and vey common constraint
among rural dwellers in KZN, Limpopo and Eastern Cape and although commonly known is in fact not
well documented in the literature. Attempts will be made in the next iteration of this model to provide
acceptable academic evidence for these changes.
The table 3above has thus been changed as shown in table 4 below. Basically the *s have been
removed
Table 7: Criteria to define the resources to manage and related strategies (version 2)

22
Minor changes were also made to some of the excel formulae used in the model.
These changes have broadened the practices recommended for most of the participants, as shown in
the examples below; one participant each from KZN, Limpopo and Eastern Cape. The practices
highlighted in brown are new practices included in version 2 of the model, a further 9 practices related
to soil and water conservation. This version is considered a better fit for conditions on the ground.
This is outlined in table 10 below.
Table 8: Basket/list of practices recommended for version 1 and 2 of the DSS
Province
KZN
Limpopo
EC
Village
Ezibomvini
Sekororo
Mxumbu
Name and Surname
Phumelele
Hlongwane
Chenne Mailula
Xolisa Dwane
DSS versions
Version
2
Version 1
Version 2
Version
1
Version
2
Version
1
Drip irrigation
0
0
0
0
0
0
Bucket drip kits
0
0
0
0
0
0
Furrows and ridges/furrow
irrigation
0
0
0
0
0
0
Greywater management
1
0
1
0
0
0
Shade cloth tunnels
1
0
1
0
0
0
Mulching
1
1
1
1
0
0
Improved organic matter
(manure and crop residues)
1
1
1
1
1
1
Diversion ditches
1
0
0
0
0
0
Grass water ways
0
0
0
0
0
0
Infiltration pits / banana circles
1
1
1
1
0
0
Zai pits
1
1
0
0
0
0
Rain water harvesting storage
1
0
1
1
1
1

23
Tied ridges
0
0
0
0
0
0
Half moon basins
0
0
0
0
1
1
Small dams
0
0
0
0
0
0
Contours; ploughing and planting
1
0
0
0
0
0
Gabions
0
0
0
0
1
1
Stone bunds
0
0
0
0
0
0
Check dams
0
0
0
0
1
1
Cut off drains / swales
0
0
0
0
1
1
Terraces
0
0
0
0
0
0
Stone packs
1
0
0
0
0
0
Strip cropping
1
0
0
0
0
0
Pitting
1
0
1
1
0
0
Woodlots for soil reclamation
1
1
0
0
0
0
Targeted application of small
quantities of fertilizer, lime etc
1
1
0
0
0
0
Liquid manures
1
1
1
1
0
0
Woody hedgerows for browse,
mulch, green manure, soil
conservation
1
1
0
0
0
0
Conservation Agriculture
1
1
0
0
0
0
Planting legumes, manure, green
manures
1
1
0
0
0
0
Mixed cropping
1
1
0
0
0
0
Planting herbs and
multifunctional plants
1
1
0
0
0
0
Agroforestry (trees + agriculture)
1
1
0
0
0
0
Trench beds/ eco circles
1
0
1
0
0
0
push-pull technology
1
1
0
0
0
0
Natural pest and disease control
1
1
0
0
0
0
Integrated weed management
1
1
1
1
1
1
Breeding improved varieties
(early maturing, drought
tolerant, improved nutrients),
1
1
1
1
1
1
Seed production /saving /storing
1
1
1
1
1
1
Crop rotation
1
1
1
1
1
1
Stall feeding and haymaking
0
0
0
0
0
1
Creep feeding and
supplementation
1
1
0
0
0
0
Rotational grazing
1
1
0
0
1
1
De-bushing and over sowing
1
1
0
0
1
1
Rangeland reinforcement
1
1
0
0
1
1
Bioturbation
1
1
1
1
1
1
Tower garden
1
1
1
1
0
0

24
Keyhole beds
1
1
1
1
0
0
No of practices recommended
35
26
16
13
14
15
For the KZNparticipant, this means that around 88% of the overall list of practices(in the practices
database)have been recommended for her. She already had the largest number of recommendations
(in version1) being a farmer in Typology B (fewer restrictions) and engaging in gardening, cropping and
livestock production. Although this is quite high, it is understood that the farmer level ranking is still
to take place and these practices can then be prioritized and narrowed down further. For the Limpopo
and EC participants, around 1/3 of practices have been recommended in their basket of options.
A general analysis of practices for the 41 households shows that only 5 practices have been
recommended for all (opposed to 4 in version 1):
•Improved organic matter
•Integrated weed management
•Breeding improved varieties
•Seed production / saving / storing
•Rainwater harvesting storage
And a number of practices have been recommended for none of the 41 HH:
•Drip irrigation
•Bucket drip kits
•Furrows and ridges/ furrow irrigation
•Stone bunds
•Terraces
•Tied ridges
•Grassed waterways
•Stall feeding and haymaking
These practices are constrained by land size, typology and slope for the most part, but are not
considered inherently unsuitable for smallholder farmers. They could still be presented to learning
groups in special cases, where their applicability is considered suitable.
Ranking of suggested practices based on score provided by the facilitator
Based on scores provided by the facilitator (the generic score used in the DSS) the basket of practices
can be ordered by preference. In the table below, a ranking based on facilitator’s scores, is provided
for the farming HH ‘Phumelele Hlongwane’ located in Ezibomvini, KZN. According to the facilitator,
improving organic matter, pitting, Conservation Agriculture and Agroforestry arethe most appropriate
interventions (having the highest score). are the most appropriate practices suggested by theDSS for
this HH. This is followed by keyhole beds, tower gardens, woody hedgerows, Zai pits and infiltration
pits.

25
Table 9:Ranking of suggested practices by ‘the facilitator’ for Phumelele Hlongwane (DSS version 2)
Ranking of suggested practices based on score provided by the farmer
A participatory impact monitoring process for the KZN participants (Bergville and Tabamhlophe)
provided an assessment of practicesactually tried out and prioritized for impact on livelihoods. This
gives us an opportunity to compare the outcomes of the computer based DSS with a real case study.
The table below summarises the practices according to those recommended through the DSS, but not
yet tried, those not recommended but tried and practices tried out that are not in the DSS list of
practices.
Table 10: Analysis of CSA practices implemented in KZN (Bergville, Tabamhlophe) –2017-2019
Practices recommended not yet
tried
Practices tried, not
recommended
Not in recommendations
Field cropping
vegetatble
gardening
Livestock
Tree andother
nat.resources
Practices
0 0 0 0
Drip irrigation
0 0 0 0
Bucket drip kits
0 0 0 0
Furrows and ridges/ furrow irrigation
0 5 0 0
Greywater management
0 8 0 0
Shade cloth tunnels
0 9 0 0
Mulching
11 11011
Improved organic matter (manure and crop
residues)
9 9 0 9
Diversion ditches
0 0 0 0
Grass water ways
010 0 0
Infiltration pits / banana circles
10 100 0
Zai pits
9 9 9 9
Rain water harvesting storage
0 0 0 0
Tied ridges
0 0 0 0
Half moon basins
0 0 0 0
Small dams
0 0 0 0
Contours; ploughing and planting
0 0 0 0
Gabions
0 0 0 0
Stone bunds
0 0 0 0
Check dams
0000 Cut off drains / swales
0 0 0 0
Terraces
9 9 0 9
Stone packs
11 0 0 0
Strip cropping
11 011 11
Pitting
9 0 9 9
Woodlots for soil reclamation
8 0 0 0
Targeted application of small quantities of fertilizer,
lime etc
0 7 0 0
Liquid manures
10 010 10
Woody hedgerows for browse, mulch, green manure,
soil conservation
11 11 11 11
Conservation Agriculture
8 8 0 8
Planting legumes, manure, green manures
9 9 0 0
Mixed cropping
9 9 0 0
Planting herbs and multifunctional plants
11 11 11 11
Agroforestry (trees + agriculture)
0 9 0 0
Trench beds/ ecocircles
7 0 0 0
push-pull technology
7 7 0 7
Natural pest and disease control
7 7 0 7
Integrated weed management
7 7 7 7
Breeding improved varieties (early maturing,
drought tolerant, improved nutrients),
6 6 0 6
Seed production / saving / storing
9 9 0 0
Crop rotation
0 0 0 0
Stallfeeding and haymaking
0 0 7 0
Creep feeding and supplementation
0 0 9 0
Rotational grazing
0 0 9 0
Debushing and oversowing
0 0 9 0
Rangeland reinforcement
9 9 9 9
Bioturbation
010 0 0
Tower garden
010 0 0
Keyhole beds
E. Score provided by facilitator for suggested
practices that are not constrained

26
Zai pits
Bucket drip irrigation
Making compost
Contours; ploughing and planting
Improved irrigation practices
Stone packs
Spring protection
Strip cropping
Limited burning of veld
Pitting
Vaccinations and dipping
Agroforestry
Natural pest and disease control
Breeding improved varieties
Seed saving
Integrated weed management
Rotational grazing
De-bushing and over-sowing
Rangeland reinforcement
Keyhole beds
The facilitated DSS processis designed to be cyclical and seasonal, to allow smallholder farmers to
prioritize and experiment with a couple of prioritized practices at a time and to build on these, over
time. The results above indicate the work to date over 2seasons. Practices blocked in green are those
that have already been planned into the coming growing season. These include strip cropping, natural
pest and disease control, seed saving and keyhole beds.
The practices not recommended by tried out by farmers, are those that should still be included in the
DSS and will be considered in the 3rd and final version of this model
Overall there is a very good coherence in practices recommended by the computer- based model and
those recommended through the facilitated process.
5. Participatory impact assessment (PIA)
For this process the PIA framework has been used to outline the indicators used at community level
and provide for a qualitative assessment of increased resilience by community members. A group
process has been designed and tested, as has an individual survey instrument. Both will be reported
on here.
In PIAs there are three basic questions:
1. What changes have there been in the community since the start of the project/process
2. Which of these changes are attributable to the projects
3. What differences have these changes made to people’s lives
5.1 PIA Workshop outline
. Recap climate change impacts
27
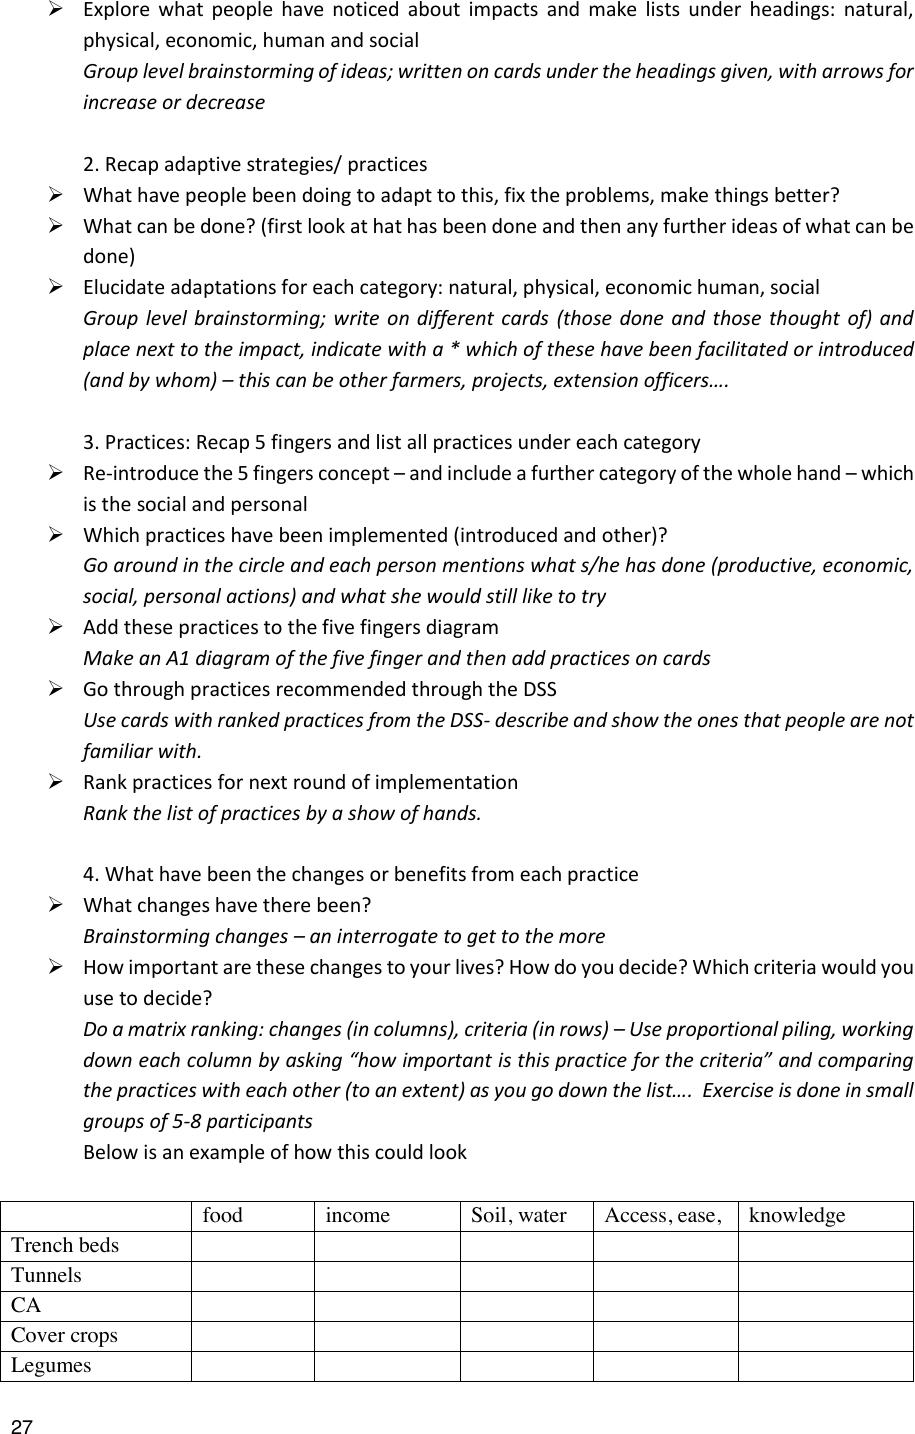
➢Explore what people have noticed about impacts and make lists under headings: natural,
physical, economic, human and social
Group level brainstorming of ideas; written on cards under the headings given, with arrows for
increase or decrease
2. Recap adaptive strategies/ practices
➢What have people been doing to adapt to this, fix the problems, make things better?
➢What can be done? (first look at hat has been done and then any further ideas of what can be
done)
➢Elucidate adaptations for each category: natural, physical, economic human, social
Group level brainstorming; write on different cards (those done and those thought of) and
place next to the impact, indicate with a * which of these have been facilitated or introduced
(and by whom) – this can be other farmers, projects, extension officers….
3. Practices: Recap 5 fingers and list all practices under each category
➢Re-introduce the 5 fingers concept –and include a further category of the whole hand –which
is the social and personal
➢Which practices have been implemented (introduced and other)?
Go around in the circle and each person mentions what s/he has done (productive, economic,
social, personal actions) and what she would still like to try
➢Add these practices to the five fingers diagram
Make an A1 diagram of the five finger and then add practices on cards
➢Go through practices recommended through the DSS
Use cards with ranked practices from the DSS- describe and show the ones that people are not
familiar with.
➢Rank practices for next round of implementation
Rank the list of practices by a show of hands.
4. What have been the changes or benefits from each practice
➢What changes have there been?
Brainstorming changes –an interrogate to get to the more
➢How important are these changes to your lives? How do you decide? Which criteria would you
use to decide?
Do a matrix ranking: changes (in columns), criteria (in rows) –Use proportional piling, working
down each column by asking “how important is this practice for the criteria” and comparing
the practices with each other (to an extent) as you go down the list…. Exercise is done in small
groups of 5-8 participants
Below is an example of how this could look
food
income
Soil, water
Access, ease,
knowledge
Trench beds
Tunnels
CA
Cover crops
Legumes
28
Other crops;
potatoes, sweet
potatoes
Savings
Subsidised inputs
Saving for inputs
Farmer centre
Small businesses
Learning group
Water committee
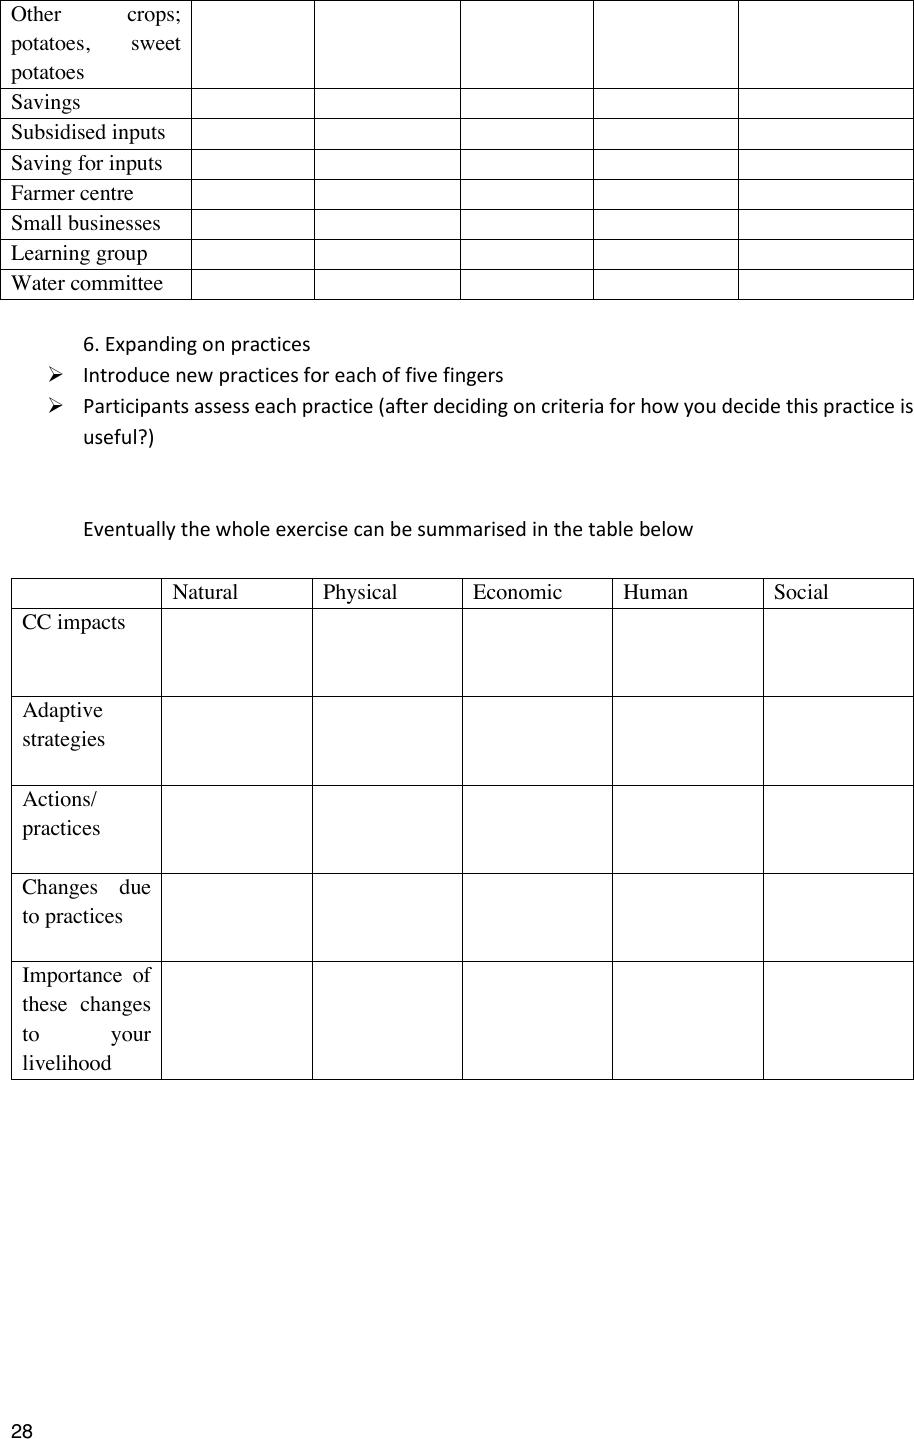
6. Expanding on practices
➢Introduce new practices for each of five fingers
➢Participants assess each practice (after deciding on criteria for how you decide this practice is
useful?)
Eventually the whole exercise can be summarised in the table below
Natural
Physical
Economic
Human
Social
CC impacts
Adaptive
strategies
Actions/
practices
Changes due
to practices
Importance of
these changes
to your
livelihood

29
5.2 Participatory Impact assessment; Bergville, Ntabamhlophe (April 2019)
Attendance
30 participants were invited; A selection of participants from
learning groups in 8 villages: Stulwane (8 participants), Thamela
(1 participant), Nthabamhlophe -Estcourt (2 participants),
Eqeleni (4 participants), Ezibomvini (10 participants),
Emazimbeni (3 participants) and Emabunzini (2 participants).
These participants represent those in the villages actively
pursuing and experimenting with some of the CSA practices
introduced and those most engaged in the mixed farming
systems typical in the area.
Right Above and Below: Bergville and Ntabamhlophe
participants in the PIA workshop
Facilitators; Lindelwa Ndaba (from Lima-RDF) joinedthe MDF
team with one of her local facilitators from Ntabamhlophe, to
learn about this process, for incorporation into her work in Food
Security in her organisation.
Climate change
Here participants summarised their observations as an
introduction into the process of assessing the impact of CSA
practices:
➢Less rainfall
➢Late rains
➢Greater intensity of storms and strong winds
➢Increased heat in spring, summer and autumn
Climate change impacts on farming and livelihoods
This exercise was repeated,partly to assess whether people’s perception of changes and impacts have
shifted, now that they are more aware to the issues at hand. It also provided an opportunity for
participants across villages and from different areas to engage with each other around their
understanding and perceptions. This exercise was conducted at the beginning of the process as well.
For this exercise the impacts were divided intothe 5 livelihood categories and is summarised inthe
table below.

30
Table 11: Impacts of practices according to livelihoods resrources
Natural
(environment and
farming
Physical
(infrastructure,
environment)
Economic
Human (Skills,
knowledge,
agency)
Social
(organisation,
cohesion)
Earthworms
disappear
Water shortages;
reduced flow in
streams and springs,
boreholes dry up
Food shortages
Increase in
diseases in
humans
No progress here
Degradationof veld
and reduced grazing
Severe erosion of
roads anddamage to
houses byheavy
rainfall
Water shortages at
household level
Farming is done
by older people;
the younger
people are lazy
People don’t
work together
Livestock break into
fields and eat crops
Dongas are increasing
in number and size
Farming inputs
and services are
very expensive
Water borne
diseases from
drinking dirty
water
Traditional
leadership is no
longer respected
More diseases in
cattle, requiring
purchase of
medication and
vaccines and more
deaths
Damage to wetlands
from people building
there, overgrazing
and other uses.
Other community
members steal
farmers’ produce
Contours in the fields,
that were made many
years ago have not
been maintained and
now there is erosion
in the fields
Severe erosion due to
denuding of land,
followed by heavy
rainfall
Learning groups;
some conflict in
some of the
learning groups
has reduced
participation.
More crop damage
from birds than before
SOME GENERAL ADAPTIVE MEASURES PROPOSED
- Savings
-Rotational group saving for buying and putting up fencing
-Small businesses
-Buying fencing
-Request support for fencing and ask Government support as well –although with the
latter participants are aware that Government support is unlikely.
COMMENTS ON PLANTING DATES
-People who planted in November-have struggled with lack of germination
-More germination for those who planted in December
-Spraying with Decis (pesticide against cutworms and stalk borer) helped with
germinationand growth (more pests were present) and reduced eating of seed by birds
-A few participants even planted in January –and this worked quite well in this last
season
-One participant in Thamela mulched her whole field and planted in November and
has had promising germination and growth from this
-Participants also notedthat beans did not grow at all, but the cowpeas have done
reasonably well, even under these difficult conditions.
It is difficult to make decisions about planting dates now that the climate is more
unpredictable.
The importance of crop residues to maintain soil moisture cannot be under-estimated
Dry soil
Seeds don’t
germinate
Extreme winds that
damage vegetation
and crops
More veld fires
More pests in crops
and new pests that
were not present in
the past
Fertilizer is
ineffective in hot, dry
conditions
Planting times for
crops are changing in
unpredictable ways
There are small water
sources in some
people’s homesteads,
which they refuse to
share with others
31
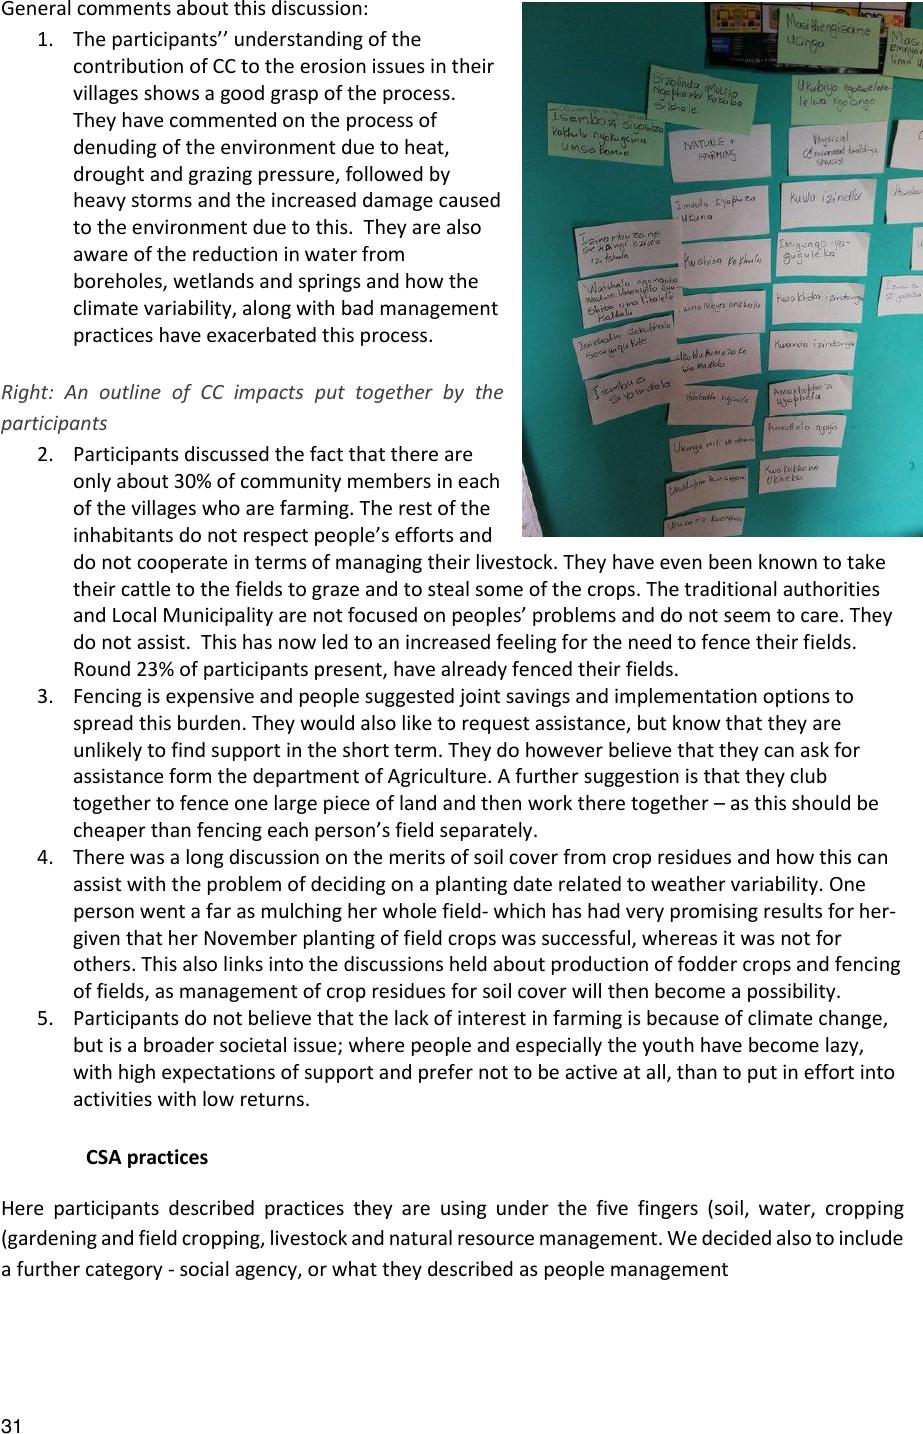
General comments about this discussion:
1. The participants’’ understanding of the
contribution of CC to the erosion issues in their
villages shows a good grasp of the process.
They have commented on the process of
denuding of the environment due to heat,
drought and grazing pressure, followed by
heavy storms and the increased damage caused
to the environment due to this. They are also
aware of the reduction in water from
boreholes, wetlands and springs and how the
climate variability, along with bad management
practices have exacerbated this process.
Right: An outline of CC impacts put together by the
participants
2. Participants discussed the fact that there are
only about 30% of community members in each
of the villages who are farming. The rest of the
inhabitants do not respect people’s efforts and
do not cooperate in terms of managing their livestock. They have even been known to take
their cattle to the fields to graze and to steal some of the crops. The traditional authorities
and Local Municipality are not focused on peoples’ problems and do not seem to care. They
do not assist. This has now led to an increased feeling for the need to fence their fields.
Round 23% of participants present, have already fenced their fields.
3. Fencing is expensive and people suggested joint savings and implementation options to
spread this burden. They would also like to request assistance, but know that they are
unlikely to find support in the short term. They do however believe that they can ask for
assistance form the department of Agriculture. A further suggestion is that they club
together to fence one large piece of land and then work there together –as this should be
cheaper than fencing each person’s field separately.
4. There was a long discussion on the merits of soil cover from crop residues and how this can
assist with the problem of deciding on a planting date related to weather variability. One
person went a far as mulching her whole field- which has had very promising results for her-
given that her November planting of field crops was successful, whereas it was not for
others. This also links into the discussions held about production of fodder crops and fencing
of fields, as management of crop residues for soil cover will then become a possibility.
5. Participants do not believe that the lack of interest in farming is because of climate change,
but is a broader societal issue; where people and especially the youth have become lazy,
with high expectations of support and prefer not to be active at all, than to put in effort into
activities with low returns.
CSA practices
Here participants described practices they are using under thefive fingers (soil, water, cropping
(gardening and field cropping, livestock and natural resource management. We decided also to include
a further category - social agency, or what they described as people management

32
Table 12:CSA practices implemented in Bergville and Nthabamhlophe
Soil
Water
Crop (garden and field)
Livestock
Natural
Resources
People
Making compost
Drip irrigation
Diversified crops in
gardens; beetroot,
Chinese cabbage, carrots,
parsley, thyme,
Vaccinations
Savings
Use of goat and
cattle manure
Mulching
Shade cloth tunnels
Dipping
Small
businesses
Canopy cover and
legumes (Lab-
Lab)
Infiltration pits
Beds: raised beds, trench
beds, eco-circles
Proper feed;
including from
fodder produced
Farmer centres
Diversified crops
to hold soil and
prevent erosion
Garden layout
with shallow
furrows for
water
harvesting and
retention
Tower gardens –fertility
and greywater
management
Addition of
supplements
Selling
chickens
Greywater
management
Conservation agriculture;
including management of
residues
Limiting
burning of veld
Improved
irrigation
practices
Inter cropping and crop
rotation
Planting grass;
ungwengwe and
kikuyu
Rainwater
storage in JoJo
tanks and
drums
Diversified crops in
fields; different varieties
of maize, sorghum, millet,
legumes (e.g. cowpeas,
beans, Lab-lab), cover
crops
Spring
protection
Use of Decis Forte
(Pyrethrins) for pest
control in fields
Buying JoJo
tanks –and
negotiating
with water
trucks tofill
these
Liquid manure
Mixed cropping in
gardens

33
From this table it can be seen that
participants have implemented a wide
range of practices in cropping and
gardening and have also started to
focus on livestockproduction and
management. Theyhave given no
attention to natural resources
management, erosion control, or soil
and water conservationin grazing
management.
Right: An analysis of practices related
to the “five fingers’ concept
In addition, participants specifically
mentioned the benefits of trench beds:
➢These beds produce very high yields
➢They keep the soil fertile for a long time and
➢They hold a lot of water –saving on irrigation needs.
In addition, although agro-ecology is promoted and organic gardening demonstrated and promoted,
the use of pesticides such as Blue Death (Carbaryl) and Bulala Zonke (Malathion) in the gardens, is
common.
In addition, in the Conservation Agriculture experimentationprocess participants have been using
Decis Forte (pyrethrin) to control both cut worm and stalk borer. Contrary to expectationsthat the
need for this pesticide would reduce over time, participants feel that it is becoming more important
with the changing weather conditions as the stalk borer load in their fields has increased. They also
believe that spraying this pesticide reduces the incidence of birds feeding on their seed.
Changes and benefits from CSA practices
This exercise consisted of doing a matrix ranking of practices farmers have used in the past year;
incorporating gardening, field cropping, livestock management, soil and water conservation and water
issues (access, availability).
Impact indicators for this exercise were developed in 2 small groups by asking participants to outline
how they make decisions about which practices to use and what changes they would observe.
Below is a summary of the Matrix for each of the 2 small groups. A process of proportional piling was
used for the scoring of each practice and indicator –where 100 counterswere provided for each
indicator and the small group decided how these would be placed proportionally for each practice. In
this way participants can comment on; more or less, and how much more or less. The outcome of the
exercise is quantifiable in terms of gauging percentages.
The 3rd group conducted an exercise in comparing different water saving practices
Matrix 1
For this matrix the practices were conflated to encompass all specific practices within that category.

34
❖Conservation agriculture; minimal tillage, soil cover, crop diversification
❖Savings: Village saving and loan associations, rotational saving in small groups towards
specific infrastructural needs, personal savings
❖Livestock; fodder production, vaccinations, dipping, supplementation
❖Gardening; bed design (trench beds, eco-circles, raised beds, tower gardens, tunnels,
mulching, mixed cropping, crop diversification, inclusion of herbs, infiltration pits and water
conservation furrows.
❖Crop rotation; 3-4 crop rotations in field cropping
❖Intercropping: grain-legume and grain -cover crop intercropping options in field cropping
❖Small businesses; including agricultural and non- agricultural businesses; sale of snacks in
schools, sewing, baking, poultry production, maize milling etc.
The impact indicatorsdeveloped by this group areof particular interest as they aremulti-
dimensional talking at least two different aspects for each indicator Additionally, the exercise
was run so that each practice is compared with the other practices when considering one of
the indicators or criteria. This greatly increases the value and reliability of the scores provided
by the group.
Table 13:Impact indicators and assessment form the Bergville PIA, April 2019
Comments:
➢The overall impact on livelihoods (which is seen as the combination of the indicators chosen
by the group) is shown under the ‘total” column. From this, the participants clearly consider
the Conservation Agriculture (CA) process as the most significant, followed by gardening,
small businesses, savings and livestock –in decreasing order
➢The practices of crop rotation and intercropping fall under the ambit of CA. the comparison
of these two practices by community members has shown some very interesting learnings
and conceptions;
oCrop rotation is considered to be better at increasing soil health and soil fertility
than intercropping –showing an internalisation by the group of the positive effects
of rotation of the main grain crops with legumes and cover crop combinations, as
Soil;
health
and
fertility
Money;
income
and
savings
Productivity;
acceptance of
practice,
saving in
farming –
equipment,
labour
Knowledge;
increased
knowledge
and ability
to use
Food;
how much
produced
and how
healthy
Water;
use and
access
Social agency;
Support,
empowerment
Total
Conservation
Agriculture
22
21
26
28
18
23
18
156
Savings
6
15
14
15
12
11
15
88
Livestock
19
11
18
7
5
12
11
83
Gardening
14
15
12
13
15
17
21
107
Crop rotation
16
12
13
12
12
15
10
90
Intercropping
12
13
15
12
11
11
9
83
Small
businesses
11
17
15
10
20
11
9
93

35
well as an observation that this works better than intercropping by itself. This
observation is clearly supported by academic evidence.
oIncome, savings and productivity are considered to be somewhat higher for
intercropping; again, a very astute observation from the group. Generally,
participants prefer crop rotation over inter-cropping, but are able to appreciate the
increases in productivity and potential income due to intercropping options.
oWater use and access is considered by this group to be quite a bit better for crop
rotation, when compared to intercropping. They have noticed the potential of
intercropped grain and legume plots as well as grain and cover crop plots to show
signs of water stress and competition for water (and potentially nutrients) between
the crops. Although, academically this is not the case in well managed fields, it is
quite likely in more infertile plots.
oRegarding social agency; group participants are more easily able to relate to the
concept of crop rotation as they find crop management in the single cropped blocks
a lot easier (including weeding and harvesting) and do not have difficult decisions to
make in terms of choices of timing of harvesting and extended harvesting periods.
Matrix 2
Money
Food
Fertility
Saving water
Total
Mulching
8
13
26
23
70
CA; Maize and bean
intercrop
11
23
20
15
69
Pipes for channelling
water to households
17
24
6
12
59
Trench beds
19
7
18
19
63
Using animal traction
13
19
6
15
53
CA; crop rotation
23
11
18
9
61
Tower gardens
9
4
6
7
26
Matrix 3; water practices ranking
This group Ranked the practices, rather than the criteria and discussions revolved primarily around
water management in gardens.
Practice
Ranking
Criteria
JoJo tanks
5
Good healthy food, watersupply, safe clean water, increased moisture
holding, reduced conflict among neighbours, and reduced costs
Grey water
1
Infiltration
pits
1
Mulching
1
Comment: The JoJo tanks assist the most, but in winter, they need to be filled from water tankers supplied by the
Municipality, which can be expensive.
Comments:
➢JoJo tanks are considered a good investment for increased water security at household and
gardening level, much more so than any of the in- situ water conservation practices such as
infiltration pits and mulching.
➢Interestingly, participants from both Bergville and Estcourt mentioned that they have
persuaded the operators for the water tankers from the municipality to fill up their JoJo
tanks for a fee. This is a win-win situation for both the participants, who can now have

36
access to a lot more water than is usually supplied to them through the municipality and the
municipalities themselves, who can now offer water to selected households and feel that
they are “doing their work”.
➢At a systemic level however, this is an extremely alarming trend. The water tankers are meant
to be a back-up plan for municipalities where their water supply falls short in terms of servicing
people and for emergencies. It has however become the main way in which water is provided
and is unfortunately part and parcel of the broader defrauding of governmentcoffers and
state capture. It is possibly the most expensive way to supply water that was ever conceived
and allows certain interests tobenefit disproportionately-namely the companies providing
and maintaining these tankers, which predictably are linked to the government officials
themselves. One tanker is said to cost around R35 000/ day to run and maintain, but only
carries around 20 000l of water- and if used to fill up JoJo tanks, can only supply around 5-10
people in a day. The feespaid to the tanker operators are also bribes,rather than an official
process, making the entire procedure extremely questionable.
Expanding on CSA practices
Participants have suggested that theywill continue expanding the CSA practices and have outlined
strategies for each of the villages. What this shows is that there is substantial potential for horizontal
expansion and learning within the communities themselves and that if a careful, fully participatory
process is used for introduction and support of CSA practices, that quite complex processes can be
talked. The community members who are still engaged in farming have a “hunger for farming systems
that are more productive and that would better support their livelihoods and take on new ideas.”
It also indicated the clearly that farmers learning from other farmers is the most successful and the
most likely to build a sustainable framework of implementation that the participants can build on.
Table 14: CSA practices still to be tried out in Bergville:2019-2020
Village
New practices
COMMENTS
Stulwane
-Fencing of fields
-Grazing management
-Making hay bales
-Fodder production
-Supplementation with protein in winter
(licks, pre-mixes and liquids)
-Saving for shade netting tunnels
There is a lot of interest in the tunnels
and participants have agreed to save
towards buying shade netting and
putting up their own structures-as the
provision of further tunnel kits through
this process is not possible.
Interest in fodder production, making
of hay and supplementation for
livestock is high and interestingly also
something that a numberof women
have volunteered to become involved
in –especially in Ezibomvini and
Eqeleni.
Emazibeni and Emabunzini are areas
where participants have come across
thework done in other villages and
have asked to be brought on board.
Eqeleni
-Fodder production-Continue with planting
different fodder types
-Making of hay bales
-Supplementation
-Saving forshade netting tunnels
Ezibomvini
-Spring protection
-Making of hay bales
-Supplementation
-Saving for shade netting tunnels
Thamela
-Eco-circle
-Saving for shade netting tunnels
Emazimbeni
-Fencing of fields
-Tower gardens

37
-Planting pottoes in bags
-Saving for shade netting tunnels
They are learning about CSA from
these groups and individuals.
Emabunzini
-Trench beds
-Saving for shade netting tunnels
Evaluation of the workshop
Some significant comments made in closing by participants included:
➢We learnt a lot by bringing people from different areas together
➢We have been provided with information on how to implement different practices such as
different types of beds in the garden and water management
➢We have also seen the proof of these practices here in Phumelele’s garden
➢We are grateful that Mahlathini has not forgotten the farmers
6. Resilience snapshots
Individual impact assessment questionnaires have been designed and linked to a resilience snapshot
questionnaire. These have been tested for 6 participants per province. As a result, the impact
assessment questionnaire has been streamlined and can now be more widely use. The questionnaire
is presented in Attachment 4 to this report.
Below a case study for the 6 KZN participants is presented.
6.1 Resilience snapshot case study for KZN
Summaries of the responses to specific questions are summarised in bullet point and tables.
Learning and change
(a)What have you learnt about dealing with CC and climatic extremes?
➢I have learnt that practices such as trench beds and CA provide good growth and yields,
despite difficult weather conditions. Also, these practices are cheap. We get more food than
we did before and will now be able to continue farming
➢Adaptive practices like mulching help to deal with increased heat and water stress
➢Practices suchas trench beds, eco-circles, mulching and mixed croppingenables the soil to
hold moisture for longer and withstand the heat and dry spells.
(b)What is your experience regarding the impact of CC on your life?
➢This season we had drought; the beans did not grow and maize is stunted. I fear will not have
enough food
➢Cattle have been negatively impacted- more disease and deaths as grazing diminishes
➢The climate is changing; low rainfall during the planting season and high temperatures are
affecting farming activities

38
➢I have not experienced climate change –I do not have water issues (participant in Midlands
of KZN)
➢Climate change has destabilised our planting patterns and has created a lot of uncertainty
about planting dates for both summer and winter crops
(c)Do you share your knowledge and experiences with the learning group or community
members?
➢Yes, I talk to my neighbours about the gardening practices, so that they can also try and
revive their gardens
➢Yes, I have talked to neighbours, some come and visit to see the garden and experiments
and some have even taken pictures.
➢Yes, I talk to my neighbours and friends and invite them to the learninggroup sessions if
they are not members yet.
(d)How do you share the knowledge gained with other members of your community?
➢Discussions at savings meetings, at the springs when we collect water
➢When people visit, I show them my garden
(e)What helps you to learn more about new innovations and information?
No
(N=6)
Comments
Listening to other farmers
experiences and experiments
6
I get motivated by other farmers’ work, get new ideas such as
planting potatoes in bags
By doing and experimenting in own
garden
4
This helps me to know how good the practices area, have tried a
no of experiments and included my own ideas
Motivated by other farmers work
and experiences
5
Learnt about raised beds in Msinga
Learning workshops
5
I find themuseful because I always hear new information and
experiences form the facilitator and farmers
(f)What new things have you added into your practices? How has it worked?
➢I have not tried anything else new, outside of the practices we were taught; CA, trench beds,
mulching, mixed cropping, RWH, greywater management, seedling production
➢I have tried a u-shaped garden which helps to collect water, helping plants to grow better.
➢I have used some of the maize and sunflower seed I grew in the CA trials to feed my indigenous
chickens; this has helped for a better survival rate and even the ability to sell a few.
Climate smart practices
(g)Impacts and lessons learnt
Past issues
Past Practice
Present Practice
Impact and lessons
Livestock
Low
production
Bartered
indigenous
chickens
Selling indigenous
chickens locally
Feed too
expensive
to buy
Fed chickens’
scraps
Feed of sunflower and
crushed maizeseed
from own production
More chickens survive and grow
well making sales possible

39
Gardening
Low yield
and dry
beds
Raised beds
Trench beds and
raised beds
Better growth and yield,
increased water holding, beds
remain moist during hot periods,
beds holdwater for a long time
fewer pests and diseases,
Fetched water from
communal taps and
springs
Also RWH andgrey
water use (unfiltered)
Saves water and time in fetching
water to irrigate
Mulch (dry grass)
Mulch retains moisture, but can
encourage termites
Buy seedlings
Seedling production
Increased numberand types of
crops;
Standard veggies
New veggies and
herbs
There is demand in the village for
the new crops; kale,Chinese
cabbage, carrots, More and
different foodfor longer periods
in the year
Short season for
planting, or no
planting due to lack
of water
Winter planting
Grow crops in garden and in the
fields (sweet potatoes, potatoes)
Field
cropping
CA
Increased water holding and less
run-off,increasedability to
withstand drought
Intercropping
Increased availability of more
types of food,
Legumes
Increased yields
Cover crops
Increased soil health, Feed
availability for livestock
(h)Assessment of impact for CSA practices tried out using local indicators
-1 = worse than normal practice
0=no change
1=some positive change
2=medium positive change
3= high positive change
Note: It has been decided subsequent to this initial piloting of this exercise to makethe scale more
symmetrical -3through to 3
Name of practice
Soil
Water
Productivity
Labour
Pest and
disease control
Cost and
maintenance
Livelihoods
Adaptation
1
Trench beds
2
2
3
-1
2
0
2
3
2
RWH
0
3
1
-1
0
-1
1
3
3
Mulching
2
2
3
0
3
0
1
2
4
Tower garden
2
3
3
2
0
0
2
2
5
Planting basins
0
2
2
0
0
1
1
1
7
Raised beds, with mulch
1
2
2
1
0
1
0
1
8
eco-circle
2
3
2
-1
1
0
1
1

40
9
CA; w intercropping, legumes,
cover crops
3
2
3
1
1
0
2
2
1o
Using goat manure (composted
in a kraal)
3
1
2
0
1
0
1
1
6.2 Resilience snapshot
A summary table of the results for all 6 participants is presented below, followed by the more in-depth
Resilience indicators
Rating for increase
Comment
Increase in size offarming
activities
Gardening–18%
Field cropping –63%
Livestock –31%
Croppingareas measured, no of livestock
assessed
Increased farming activities
No
Most participants involved in gardening, field
cropping and livestock management
Increased season
Yes
For field cropping and gardening-autumn and
winter options
Increased crop diversity
Crops: 12 new crops
Practices: 8 new practices
Management options include; drip irrigation,
tunnels, no-till planters, JoJotanks, RWH
drums,
Increased productivity
Gardening–72%
Field cropping –79%
Livestock –25%
Based on increase in yields
Increased water use
efficiency
25%
Access, RWH, water holding capacity and
irrigation efficiency rated
Increased income
13%
Based on average monthly incomes
Increased household food
provisioning
Maize- 20kg/week
Vegetables –7kg/week
Food produced and consumed in the household
Increased savings
R150/month
Average of savings now undertaken
Increased social agency
(collaborative actions)
2
Villages savings and loanassociations and
learning groups
Increased informed decision
making
5
Own experience, local facilitators, other
farmers, facilitators, extension officers
Positive mindsets
2-3
More tomuch more positive about the future:
Much improvedhousehold food security and
food availability
RESILIENCE SNAPSHOT
(6 participants)
Date
Feb-19
Province
KZN
Bergville, Midlands
Village
Ezibomvini, Eqeleni and Gobizembe
Increased in
farming (Size)
Before (Size
in sqm)
Now (Size
in sqm)
Comment: Percentage increase
Gardening
76
93
18%
Field
cropping
1400
3767
63%
Livestock
22
32
31%
Trees nat
resources
4
4
0%
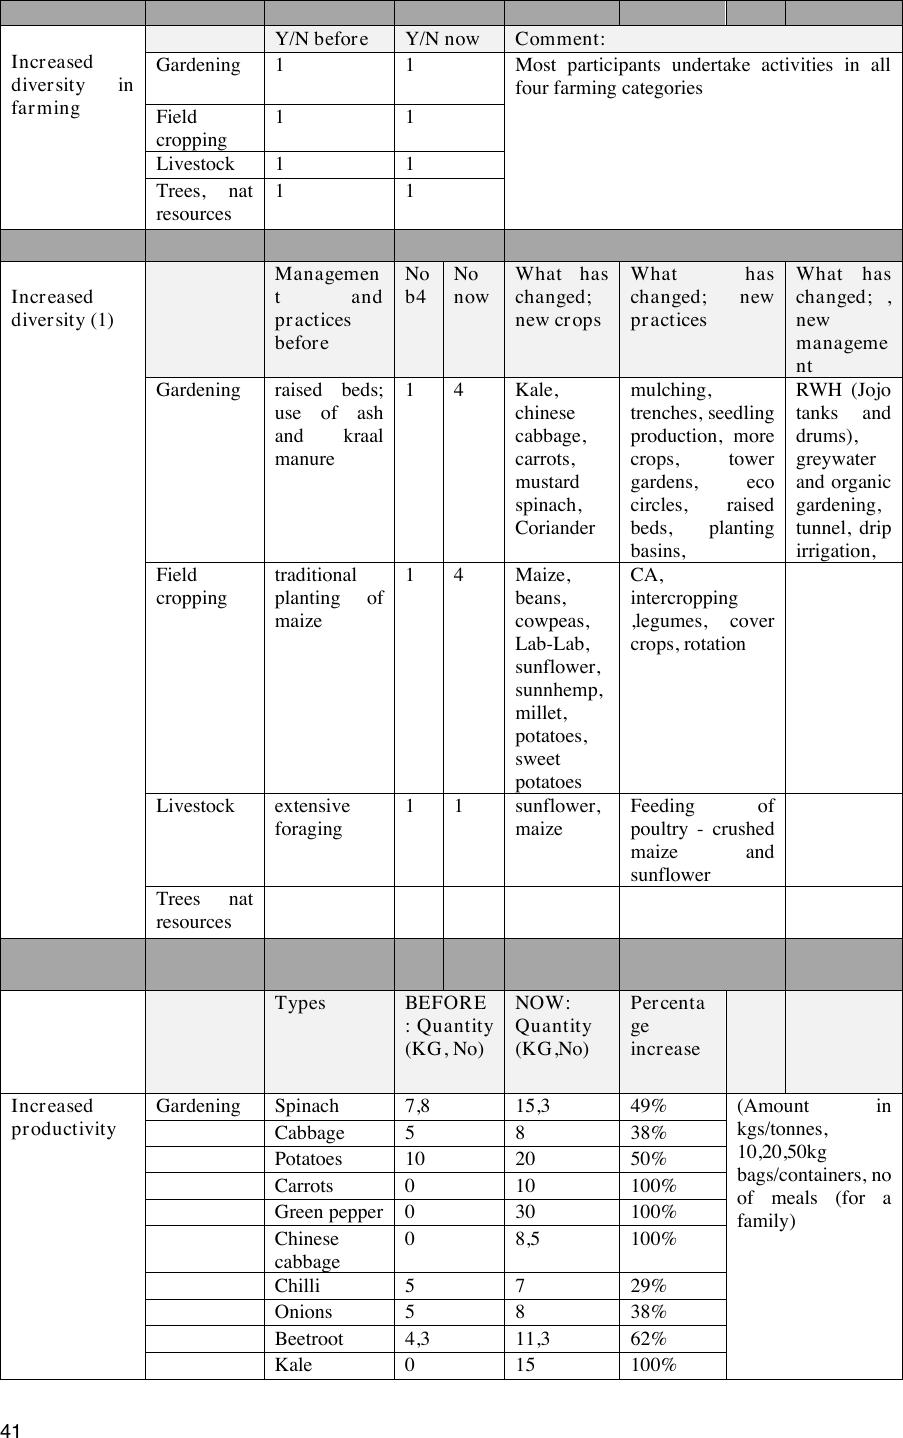
41
Increased
diversity in
farming
Y/N before
Y/N now
Comment:
Gardening
1
1
Most participants undertake activities in all
four farming categories
Field
cropping
1
1
Livestock
1
1
Trees, nat
resources
1
1
Increased
diversity (1)
Managemen
t and
practices
before
No
b4
No
now
What has
changed;
new crops
What has
changed; new
practices
What has
changed; ,
new
manageme
nt
Gardening
raised beds;
use ofash
and kraal
manure
1
4
Kale,
chinese
cabbage,
carrots,
mustard
spinach,
Coriander
mulching,
trenches, seedling
production, more
crops, tower
gardens, eco
circles, raised
beds, planting
basins,
RWH (Jojo
tanks and
drums),
greywater
and organic
gardening,
tunnel, drip
irrigation,
Field
cropping
traditional
planting of
maize
1
4
Maize,
beans,
cowpeas,
Lab-Lab,
sunflower,
sunnhemp,
millet,
potatoes,
sweet
potatoes
CA,
intercropping
,legumes, cover
crops, rotation
Livestock
extensive
foraging
1
1
sunflower,
maize
Feeding of
poultry -crushed
maize and
sunflower
Trees nat
resources
Types
BEFORE
: Quantity
(KG, No)
NOW:
Quantity
(KG,No)
Percenta
ge
increase
Increased
productivity
Gardening
Spinach
7,8
15,3
49%
(Amount in
kgs/tonnes,
10,20,50kg
bags/containers, no
of meals (for a
family)
Cabbage
5
8
38%
Potatoes
10
20
50%
Carrots
0
10
100%
Green pepper
0
30
100%
Chinese
cabbage
0
8,5
100%
Chilli
5
7
29%
Onions
5
8
38%
Beetroot
4,3
11,3
62%
Kale
0
15
100%

42
Mustard
spinach
0
30
100%
Coriander
0
30
100%
72
%
Field
cropping
Maize
99,3
257,8
61%
Beans
4
16,8
76%
Cowpea
0
5
100%
79
%
Livestock
Chickens
15
20
25%
Trees nat
resources
Increas
e
Access
Inc
RWH
Inc water
holding
incr water
productivity
(irrigation)
SCALE
Increased water use
efficiency (incl RWH,
water holding, water
access, water
productivity)
1
1
2
1
0= same or worse than before;
1= somewhat better than before,
2= much better than before
Increased
livelihood security
(income)
Income before
(ave monthly in
Rands)
Income now (Ave
monthly in Rands)
Comments
1433
1650
Increased
livelihood security
(Household
provisioning and
food security)
Food types (staples, veg,
livestock, fruit)
Quantity/
week (kg)
No of
times/
week (1-7)
Sales/week
(in Rands)
Comments
maize
20
7
0
6 of 6
Veg (Spinach, chillies,
green pepper)
10
5
225
2 of 6
Veg(spinach,chinese
cabbage, tomato
10
3
0
6 of 6
Veg (beetroot, chilli)
1
1
0
6 of 6
Chicken
2
2
0
1 of 6
Pigs (kg of meat)
10
1
2500
1 of 6
Cattle (no sold/yr)
1
10000
1 of 6
Fruit
1
1
1 of 6
Increased
livelihood
diversity/optio
ns
Income
options
Before
Income
options Now
Comment; name new
options e.g. which
crops, etc
Scale
1,4
1,3,4
Small incomes form
farming now possible
1=social grants; 2= remittances;
3=farming income;4= small
business
Amount per
month
Before
Amount per
month Now
Use of
savings
Scale
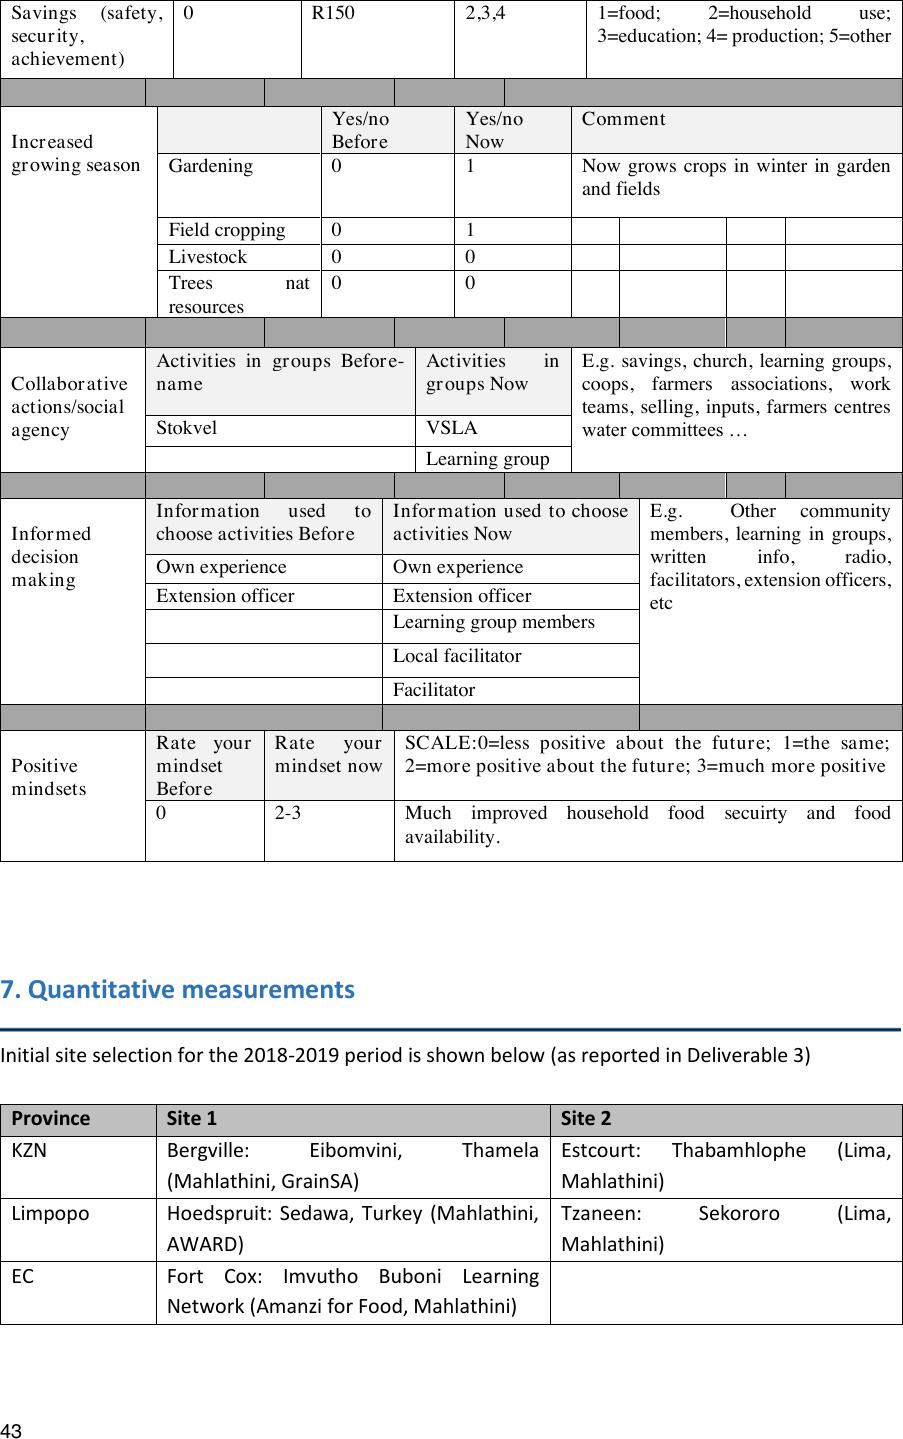
43
Savings (safety,
security,
achievement)
0
R150
2,3,4
1=food; 2=household use;
3=education; 4= production; 5=other
Increased
growing season
Yes/no
Before
Yes/no
Now
Comment
Gardening
0
1
Now grows crops inwinter in garden
and fields
Field cropping
0
1
Livestock
0
0
Trees nat
resources
0
0
Collaborative
actions/social
agency
Activities in groups Before-
name
Activities in
groups Now
E.g. savings, church, learning groups,
coops, farmers associations, work
teams, selling, inputs, farmers centres
water committees …
Stokvel
VSLA
Learning group
Informed
decision
making
Information used to
choose activities Before
Information used tochoose
activities Now
E.g. Other community
members, learning in groups,
written info, radio,
facilitators, extension officers,
etc
Own experience
Own experience
Extension officer
Extension officer
Learning group members
Local facilitator
Facilitator
Positive
mindsets
Rate your
mindset
Before
Rate your
mindset now
SCALE:0=less positive about the future;1=the same;
2=more positive about the future; 3=much more positive
0
2-3
Much improved household food secuirty and food
availability.
7. Quantitative measurements
Initial site selection for the 2018-2019 period is shown below (as reported in Deliverable 3)
Province
Site 1
Site 2
KZN
Bergville: Eibomvini,Thamela
(Mahlathini, GrainSA)
Estcourt: Thabamhlophe (Lima,
Mahlathini)
Limpopo
Hoedspruit: Sedawa, Turkey (Mahlathini,
AWARD)
Tzaneen: Sekororo (Lima,
Mahlathini)
EC
Fort Cox: Imvutho Buboni Learning
Network (Amanzi for Food, Mahlathini)
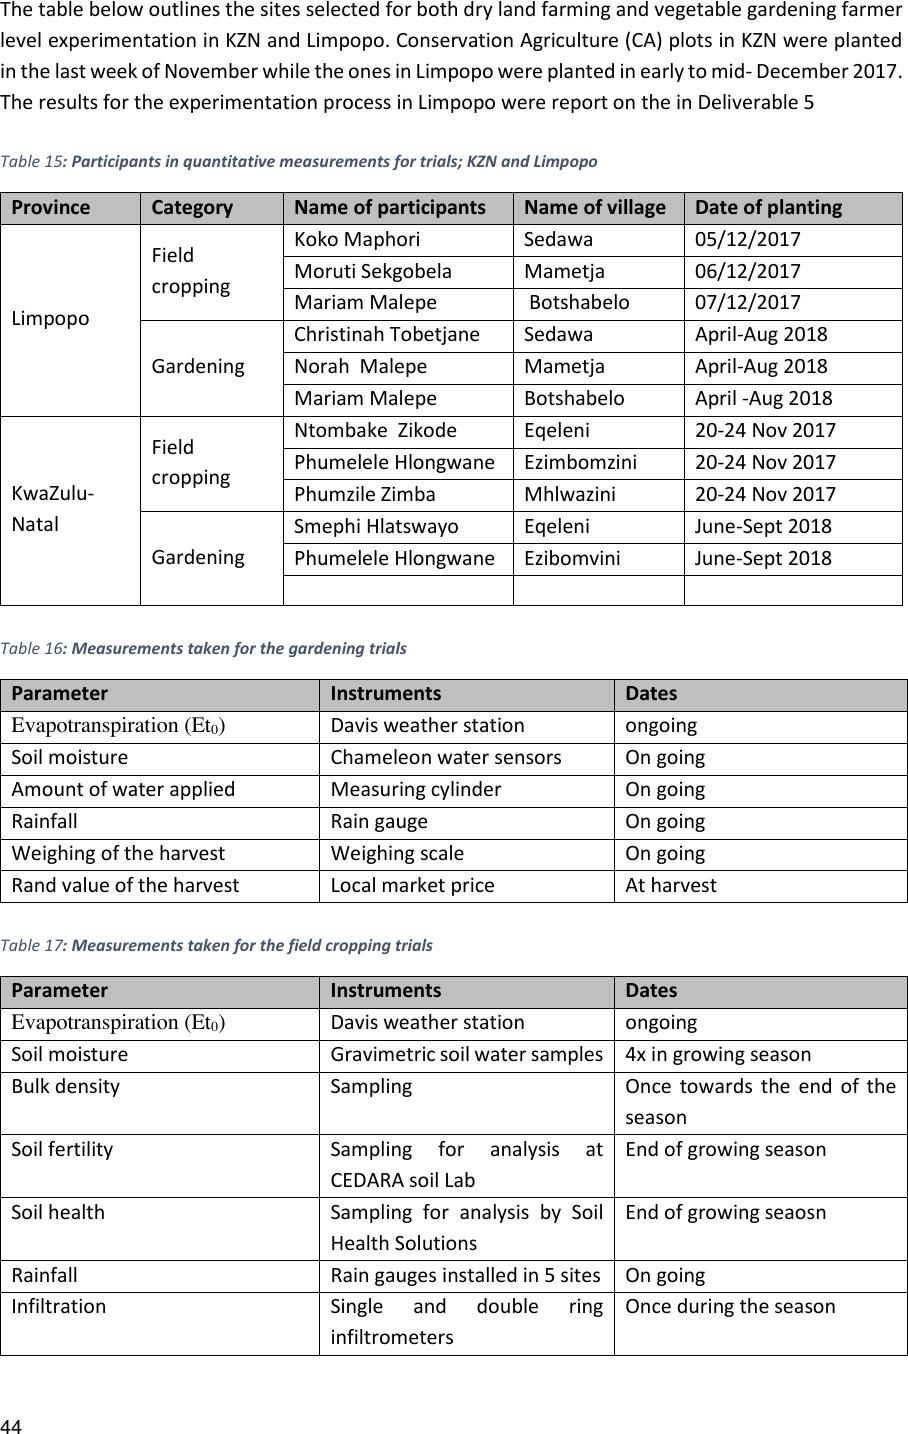
44
The table below outlines the sites selected for both dry land farming and vegetable gardening farmer
level experimentationin KZN and Limpopo.Conservation Agriculture (CA) plots in KZNwereplanted
in the last week of November while the ones in Limpopo were planted in early to mid-December 2017.
The results for the experimentation process in Limpopo were report on the in Deliverable 5
Table 15: Participants in quantitative measurements for trials; KZN and Limpopo
Province
Category
Name of participants
Name of village
Date of planting
Limpopo
Field
cropping
Koko Maphori
Sedawa
05/12/2017
Moruti Sekgobela
Mametja
06/12/2017
Mariam Malepe
Botshabelo
07/12/2017
Gardening
Christinah Tobetjane
Sedawa
April-Aug 2018
Norah Malepe
Mametja
April-Aug 2018
Mariam Malepe
Botshabelo
April -Aug 2018
KwaZulu-
Natal
Field
cropping
Ntombake Zikode
Eqeleni
20-24 Nov 2017
Phumelele Hlongwane
Ezimbomzini
20-24 Nov 2017
Phumzile Zimba
Mhlwazini
20-24 Nov 2017
Gardening
Smephi Hlatswayo
Eqeleni
June-Sept 2018
Phumelele Hlongwane
Ezibomvini
June-Sept 2018
Table 16: Measurements taken for the gardening trials
Parameter
Instruments
Dates
Evapotranspiration (Et0)
Davis weather station
ongoing
Soil moisture
Chameleon water sensors
On going
Amount of water applied
Measuring cylinder
On going
Rainfall
Rain gauge
On going
Weighing of the harvest
Weighing scale
On going
Rand value of the harvest
Local market price
At harvest
Table 17: Measurements taken for the field cropping trials
Parameter
Instruments
Dates
Evapotranspiration (Et0)
Davis weather station
ongoing
Soil moisture
Gravimetric soil water samples
4x in growing season
Bulk density
Sampling
Once towards the end of the
season
Soil fertility
Sampling for analysisat
CEDARA soil Lab
End of growing season
Soil health
Sampling for analysis by Soil
Health Solutions
End of growing seaosn
Rainfall
Rain gauges installed in 5 sites
On going
Infiltration
Single and double ring
infiltrometers
Once during the season

45
Run-off
Run-off plots installed in three
sites
On going
Weighing of the harvest
Weighing scale, including grain
and biomass (lab analysis)
At the end of the growing
season- for Mazie only
Rand value of the harvest
Local market price
At harvest
Data for a number of the quantitative measurements were rereported on in detail in Deliverables 5
(Limpopo) and 6 (KZN). In this report we will provide a focus on the water productivity results only.
7.1 Water Productivity in Conservation Agriculture
Due to crop failure in Limpopo (for both seasons 2017 and 2018), water productivity was calculated
for the Bergville (KZN) sites only.
Data collection in this season provided a few challenges:
•Inexperience with working with weather stations meant the ET0values were not
automatically recorded as could have been the case, but had to be manually calculated using
surrogate data obtained from SA Weather Services weather stations close to the project site
(Bergville).
•Rainfall was not measured very accurately by the households with rain gauges- some
participants were a lot more meticulous than others.
As a result, the data collected in this season was not adequate to run a model to allow us to compare
simulated and observed values of evapotranspiration (ET) and water productivity (WP). The results
presented in this section were observed values and were computed manually following the equations
presented in the methodology section.Detail of the data and equatiosn used are provided in
Deliverable 6 of this project.
Our assumption for this farmer level experiment, or the hypothesis, is that water productivity of an
intercropping system will be better than that of a monocropping system under CA.
Enough data was collected for two of the three sites and participants; Phumelele Hlongwane from
Ezibomvini (PH) and Ntombakhe Zikode from Eqeleni (NZ).
Note: These participants have provided express permission to the research team to use their trial
information in reporting and in publications. This is in lieu of a formal academic ethical clearance,
which is still pending from UKZN and UWC. Both submissions were made almost two years ago, but
expediting of these clearances have not been possible to date, despite numerous attempts.
Trial and Control layouts and parameters
Phumelele Hlongwane (Ezibomvini- Bergville)
Experimentation
Phumelele’s trials were continued in this season. The layout of herplots is shown below for the
2015/16, 2016/17 and 2017/18 planting seasons. She is practisingpracticingcrop rotationas well as
intercropping and planting of summer and winter cover crop mixes.
(10)
M + B
(5)
LL
(8)
M + B
(6)
M +LL
(3) M +
SCC +WCC
Contr
ol plot
(9)
M + CP
(7)
M + CP
(4)
M + B
(2)
Sunhemp,
millet and
sunflower
(1)
M + B

46
The table below provides a summary of the rotations employed across her trial plots.
Table 18: Table outlining rotations undertaken in Phumelele’s trial and control plots over the last three seasons, including
an indication of installation of runoff plots.
Plot no
2015/16
2016/17
2017/18
Run off plots
1
M+B
M
M +WCC
Grey squares indicate run-off plots
2
SCC
M
M+B
(10)
M + B
(5)
M
Control plot
(8)
M + CP
(6)
sunhemp,
millet and
sunflower
(3)
M + B
Contro
l plot
(9)
M + B
(7)
M
(4)
LL
(2) M +
runoff
plot
(1)
M
Trial layout 2016/17 Legend: M –Maize; B –Beans; CP –Cowpea; LL –Lab lab
(10)
M
(5)
LL
Control plot
(8)
B
(6)
M +CP
(3)
M
Contro
l plot
(9)
SCC
(7)
M + CP
(4)
M
(2)
M + B
(1)
M
Trial layout 2017/18 Legend: M –Maize; B –Beans; CP –Cowpea; LL –Lab Lab

47
Right: A view of Phumelele’s maize
and cowpea intercropped plot and
Far Right: A view of Phumelele’s
Lab-Lab plot in the 2017-2018
season. She rotates these plots in
her intercropping and rotation
system. Behind the visitors is a plot
of inter cropped maize and
sunflower.
Ntombakhe Zikode (Eqeleni)
Experimentation
In Eqeleni, the 1000 m2 farmer level trials are divided into 5 plots (20 m*10 m). The last crop rotation
plot is split into two to allow for 2x (10 m* 10 m) plots, planted to sole Maize crop and summer cover
crop mix of sunflower, sunnhemp and millet respectively.
Right: Ntombakhe’s trial plot, early stages of the
summer cover crops in the foreground. Behind that
and to the right are her inter cropped plots and on
the left at the back her mono-cropped maize plots.
3
M+SCC+WCC
M+B
M
Rotations have been doneattempting
to ensure a different crop/crop mix on
each plot in each consecutive year.
A further refinement of the schedule to
be a 3-year rotationof; single crop –
intercrop-cover crop, will be adhered
to into the future
4
M+B
LL
M
5
LL
M
LL
6
M+LL
SCC
M+CP
7
M+CP
M
M+CP
8
M+B
M+CP
B
9
M+CP
M+B
SCC
10
M+B
M+B
M
Control: M
Control: M
Control: M
(CA)
Control: M+B
(CA)
M+B+WCC
M+B+WCC
M+C
M+B
M
SCC

48
Water Productivity results and discussion; Method 1
The results for calculating the WP using method 1 (weather station data) for both Phumelele
Hlongwane and Ntombakhe Zikode are shown below.
Figure 6: Water productivity results using weather station data for dryland field cropping using CA
Water productivity here has been calculated using the maize grain only.
From the above diagram the following observations can be made:
•Phumelele’s water productivity for all her plots is substantially higher than Ntombakhe’s.
This is expected, as her soil fertility and soil health results are also substantially higher. This
means that her soil has a much higher nutrient and water holding capacity, despite the fact
that both participants have bene practising CA for 4-5 years. It points also to the fact that
her management practices within the CA system are improving her soils more substantially
than those that Ntombakhe have been using. Crop rotation by itself improves soil health
and water holding capacity much more slowly than a combination of rotation and
intercropping. Larger crop diversity is also important.
•For both participants the water productivity for their maize and bean intercropped plots is
higher than for the maize only and the maize and cowpea plots. This trend has been noted
also in the soil health test results and is interesting as it does not hold with the assumptions
made by the implantation team that the maize and cowpea intercropped plots would out-
perform the maize and bean intercrops.
•For both participants the water productivity of the mono-cropped maize plots is higher than
that of their maize and cowpea intercropped plots. This points to a certain level of
competition from the cowpeas intercropped with the maize
•For Phumelele, water productivity for her CA control mono-cropped maize is quite a bit
higher than her CA trial mono-cropped maize. Her management practices for the two plots
are very similar (using the same procedures, fertilizers and maize varieties), pointing to
different water productivity potentials in her plots. This variability has been noted also in
measurements of soil characteristics, water holding capacity and yields.
WP (kg/m3)21.8154 35.2557731.7444344.0499410.3916711.4949 13.250578.588552
0.00
5.00
10.00
15.00
20.00
25.00
30.00
35.00
40.00
45.00
50.00
Water Productivty (kg/m3)
WP (kg/m3)

49
The yields across the plots within a trial can vary considerably. The expectation is that after a number
of years, the mixture of intercropping and crop rotation would mean that the soil builds up across the
plots and that the yields would even out as they increase. This is as yet not happening.
A more in-depthlook at the actual rotations and yields for Phumelele Hlongwane, are presented in
the table below.
Table 19: Maize yields per plot in Phumelele Hlongwane’s rotation system:2015-2017
Phumelele Hlongwane: Comparison of maize yields per plot:2015-2017
Plots
2015/2016 season
2016/2017 Season
2017/2018 Season
Crops Planted
Yields
(t/ha)
Crops planted
Yields
(t/ha)
Crops planted
Yields
(t/ha)
Change
in yield
(t/ha)
Plot 10
Maize +Beans
8,3
Maize + Beans
8,8
Maize
11,5
2,8
Plot 9
Maize +Cowpea
8,7
Maize + Beans
8,9
SCC
Plot 8
Maize + Beans
10,4
Maize + Cowpea
7,7
Beans
Plot 7
Maize +Cowpea
6,9
Maize
6,5
Maize + Beans
16,3
9,8
Plot 6
Maize +Lab-lab
3,4
SCC
Maize +
Cowpea
12,4
Plot 5
Lab-Lab
NA
Maize
8,8
Lab-Lab
NA
Plot 4
Maize+ Beans
8,7
Lab-lab
Maize
10,3
Plot 3
M +SCC+WCC
8,7
Maize + Beans
10,1
Maize
11,0
0,9
Plot 2
SCC
Maize
10,0
Maize + Beans
14,2
4,2
Plot 1
Maize +Beans
6,9
Maize
6,2
Maize
8,9
2,7
This season (2017-2018) has seen a remarkable increase in yield across all the plots where maize has
been grown, with yields that seem to be almost unheard of. These calculations and yields have been
checked and re-checked giventhis nearimpossibleoutcome and appear to be correct as far as the
team can tell. The variety of maize planted was PAN6479.
Rainfall as recorded by the farmers has averaged around 563mm this season as compared to an
average of around 527mm for last season. These amounts are considered similar enough to not have
a major influence on yield differences noticed.
The difference in maize yield from one plot to another does notappearto be directly related to the
previous rotations, although in general those that include legumes and summer cover crops in a three-
year rotation prior to planting a monocrop of maize, are higher than the plots where maize has
followed on maize.
Biomass water productivity results
These have been calculated for maize plants only. The graph below provides the dry mass of the whole
above ground plant, for those plants selected also to measure the grain yiled for the WP results shown
above

50
Figure 7: Biomass water productivity results using weather station data for dryland field cropping using CA
From the graph above the following comments can be made:
•Phumelele’s biomass results for all her plots is substantially higher than Ntombakhe’s.
•Biomass results for the mono-cropped trial maize plots are higher than the maize and bean
and maize and cowpea intercropped plots for both participants. This shows that even
though the grain production for maize is increased in the maize and bean intercropped plots,
the biomass yield of maize is reduced in the intercropping situation. This does however not
include the added grain and biomass yields of the legumes themselves.
•Biomass results for the maize and bean intercropped plots are higher than the maize and
cowpea intercropped plots for both participants. For the maize and cowpea intercropped
plots both the grain and biomass yields for maize are reduced and do not hold with the
assumption that intercropping with cowpeas can improve growth of the maize plants.
•For Phumelele, the biomass results for her maize mono-crop trial plots are substantially
higher than her maize monocrop CA control plot. Here the value of the rotation and
intercropping becomes more visible, given that the CA control plot is planted to maize every
year but the maize CA trial plot is rotated within her trial. The latter provides for a
substantial increase in biomass production and also water productivity.
In summary the WP results indicate the following:
•Water productivity for mono cropped maize is substantially improved in a crop rotation
system under CA (3- year rotation that includes legumes and a mix of cover crops)
•Water productivity for maize and bean intercrops (grain and biomass yield) is higher than
maize produced in a mono-crop under CA
•Water productivity for maize and cowpea intercrops (grain and biomass) is lower than both
maize produced in a mono-crop and maize and bean intercrops.
86.86667 42.8 63.57333 82.9333333.820.7219.44 17.408
0
10
20
30
40
50
60
70
80
90
100
Biomass kg/m3
Biomass data(kg/m3)
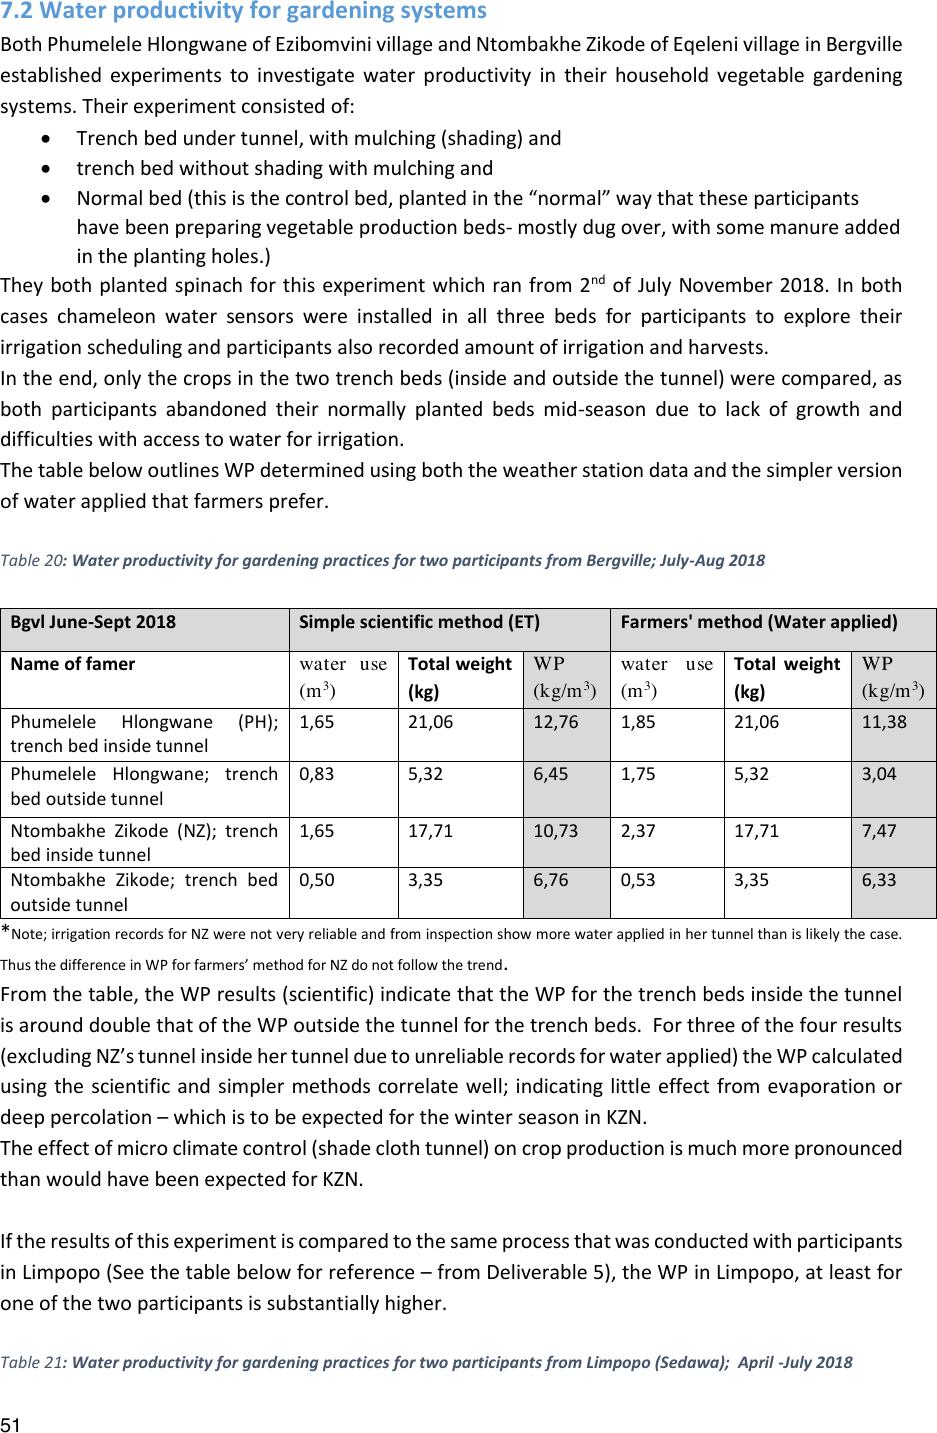
51
7.2 Water productivity for gardening systems
Both Phumelele Hlongwane of Ezibomvini village and Ntombakhe Zikode of Eqeleni village in Bergville
established experiments to investigate water productivity in their household vegetable gardening
systems. Their experiment consisted of:
•Trench bed under tunnel, with mulching (shading) and
•trench bed without shading with mulching and
•Normal bed (this is the control bed, planted in the “normal” way that these participants
have been preparing vegetable production beds- mostly dug over, with some manure added
in the planting holes.)
They both planted spinach for this experiment which ran from 2nd of July November 2018. In both
cases chameleon watersensors wereinstalled inall three beds for participants to explore their
irrigation scheduling and participants also recorded amount of irrigation and harvests.
In the end, only the crops in the two trench beds (inside and outside the tunnel) were compared, as
both participantsabandoned their normally plantedbeds mid-season due to lack of growthand
difficulties with access to water for irrigation.
The tablebelow outlines WP determined using both the weather station data and the simpler version
of water applied that farmers prefer.
Table 20: Water productivity for gardening practices for two participants from Bergville; July-Aug 2018
*Note; irrigation records for NZ were not very reliable and from inspection show more water applied in her tunnel than is likely the case.
Thus the difference in WP for farmers’ method for NZ do not follow the trend.
From the table, the WP results (scientific) indicate that the WP for the trench beds inside the tunnel
is around double that of the WP outside the tunnel for the trench beds. For three of the four results
(excluding NZ’s tunnel inside her tunnel due to unreliable records for water applied) the WP calculated
using the scientific and simpler methods correlate well; indicating little effect from evaporation or
deep percolation –which is to be expected for the winter season in KZN.
The effect of micro climate control (shade cloth tunnel) on crop production ismuch more pronounced
than would have been expected for KZN.
If the results of this experiment is compared to the same process that was conducted with participants
in Limpopo (See the table below for reference –from Deliverable 5), the WP in Limpopo, at least for
one of the two participants is substantially higher.
Table 21: Water productivity for gardening practices for two participants from Limpopo (Sedawa); April -July 2018
Bgvl June-Sept 2018
Simple scientific method (ET)
Farmers' method (Water applied)
Name of famer
water use
(m3)
Total weight
(kg)
WP
(kg/m3)
water use
(m3)
Total weight
(kg)
WP
(kg/m3)
Phumelele Hlongwane (PH);
trench bed inside tunnel
1,65
21,06
12,76
1,85
21,06
11,38
Phumelele Hlongwane; trench
bed outside tunnel
0,83
5,32
6,45
1,75
5,32
3,04
Ntombakhe Zikode (NZ); trench
bed inside tunnel
1,65
17,71
10,73
2,37
17,71
7,47
Ntombakhe Zikode; trench bed
outside tunnel
0,50
3,35
6,76
0,53
3,35
6,33

52
Simple scientific method (ET)
Farmers' method (Water applied)
Name of famer
water
use
(m3)
Total
weight (kg)
WP
(kg/m3)
water
use (m3)
Total weight
(kg)
WP (kg/m3)
Christina Thobejane (Tunnel;
trench beds, with mulch)
0,8
48,9
65
1,10
48,9
56,7
Christina Thobejane (Furrows and
ridges with mulch)
0,5
24,5
46,4
3,91
24,5
5
Christina trench outside
0,8
14,7
18,4
2,93
14,7
11,3
Nora Mahlako (Tunnel;trench
beds without mulch)
0,8
19,6
26
9,47
19,6
5
One of the reasons for this trend could be that the participants in Bergville were in fact over-irrigating
their beds initially, an assumption corroborated by the Chameleon water sensor data presented
below. The Bergville participants kept more to the suggested practice of using the drip kits and then
added water by hand if they thought that their beds looked dry. They did not water according the
chameleon sensor readings. It would appear that the suggested practice of one bucket (20l) per day
for the dripping system in fact led to overwatering. This could also be due to the fact that these crops
were grown during the winter and that water demand in this period is lower.
Cost-benefit analysis for the Gardening systems in Limpopo and KZN
Bergville cost-benefit
A cost-benefit analysis for the trench beds in and outside tunnels for the Bergville area is shown in the
table below. The calculation was done by comparing the cost of the water applied with income earned
from sales.
Water
applied
Cost
(R/m2)
Yield/ m2
Sales
(Rands / m2)
Profit (R/m2)
Trench inside tunnel (PH)
1650
R0,00
2,6
R26
R26,00
Trench inside tunnel (NZ)
1650
R13,12
2,6
R26
R12,80
Trench outside tunnel (PH)
830
R0,00
1,6
R16
R16,00
Trench outside tunnel (NZ)
830
R6,64
1,6
R16
R9,36
This indicatesthe income potential for these smalltunnels to be around R400 for a 3month period,
growing spinach and assuming water does not need to be paid for. Note that in some cases
participants are paying R300/2500l to have their Jo-Jo tanks filled up. In this case the profitability
reduces dramatically to around R12,8/m2(assume 15m2of planting inside and outside the tunnel)
The participants also visually compared the growth of the spinach crop throughout the season
The photos below are indicative.

53
Right: Spinach growing in
Phumelele’s Tunnel Far Right:
Spinach growing outside the
tunnel
Right: Spinach harvested from
trench bed insidetunnel and Far
Right: spinah harvested from
outside the tunnels
From observations, the
quality of the spinach in
the tunnel is better than
that of the spinach ouside
the tunnel, spinach leaves
outside the tunnel are
darker and shorter
compared to those inside
the tunnel.
Sedawa Cost benefit
AA rough estimate of cost nad benefit for Christinah thobejane in Limpopo is shown below. This small
table assumes payment for water, as this has been the case in Limpopo.
Water
Cost
(R/m2)
Yield
Sales
(Rands/ m2)
Profit
(R/m2)
Trench inside tunnel
1100
R18,70
6 bundles/m2
R60
R41,30
Trench outside tunnel
2926
R48,80
4,2 bundles/m2
R42
-R6,80
Furrows and ridges
3913
R130,40
2,4 bundles/m2
R24
-R106,40
From a water use efficiency point of view, planting in a trench bed without shading (microclimate
management) requires 2.9 times the amount of water required in a deep trench under shade cloth.

54
The quantities of spinach produced in the tunnel are much higher than those produced outside the
tunnel. The cost-benefit analysis above indicates, that if water needs to be bought, it would only be
profitable to plant inside the tunnel. The profit is however not very high in this context (~R620/tunnel
fully planted(15m2)), for a season. Obviously, if cheaper water can be accessed, this would be a lot
more.
7.3 Visual /Qualitative Assessments
This methodology has been tried each year in the Bergville area, as a potential peer review system for
assessing soil quality. Below is the scoring sheetthat has beendesigned for this assessment. This
assessment has been altered slightly in terms of indicators used when compared to similar processes
employed
34
, to accommodate for tests that are seen to be very similar in the original forms. An
example is surface ponding and infiltration, which in our version has been changed to infiltration only.
For the 2018-2019 a revised VSA has been conducted taking the learnings from the previous seasons
into account.
Some of the indicatorshave been removedas their visual assessment by team members in the field
was either too subjective or could not be done in a way that real differences between fields and
participants could be assessed. These include: soil colour, soil porosity,soil mottles and run-off. Soil
cover is still being assessed, but through a different monitoring process.
It also included some newtechniques, mostly ones from a visual scoring
index for soil compaction developed by Prof. Dr Thomas Weyer from
Westphalia University in Germany
5
. These are soil surface texture, root
growth, soil colour, bulk density and Coarse pore content.
The implementation team was re-trained in this new methodology in the
field on 22-23 October 2018. Then a piloting exercise for thisnew
methodology was conducted in one village (Stulwane) in Bergville late in
November
Right; Sylvester Selala demonstrates the use of a quadrant to more reliably assess
percentage soil cover.
An updatedVSA manual(see Attachment 2)with the revised indicator
sheet shown below has been produced.
Table 22: New redesigned VSA Indicator sheet for 2018
Visual indicator of Soil Quality
Visual Score (VS)
Weight
Comments
Soil Structure (clods, aggregates)
0 = Poor
conditions;
1 = Moderate
conditions;
4
Shatter test
Soil porosity (macro pores, clods)
5
Coarse pore content
Soil colour (dark, average, light and
uniformity (mottles)
3
Incl mottles and organic matter
3
Sheperd G. 2010. Visual Soil Assessment Field Guide: Part 1: Maize. FAO, Rome
4
Sheperd G, Bailey J, Johnson P. 2012. Visual Soil Assessment. SMI and Vaderstad. New Zealand.
5
Ministry of Climate Protection, Environment, Agriculture and Consumer Protection. May 2016.Preventing Soil
Compaction. Preserving and restoring soil fertility. Including the classification key for detection and evaluation of Harmful Soil
Compaction in the Field. Authors T Weyer and SR.S. Boeddinghaus, Westphalia University, Dusseldorf, Germany.

55
Soil surface (crusting, siltation, runoff)
2 = Good
conditions
x 3
Assessment of soil surface texture
Earthworm counts
2
Soil cover (0-15%;15-30%; >30%)
3
Revised scale, using quadrant
Soil depth (penetrationresistance to rod
into soil)
2
Bulk density
2
Using knife tip penetration in a
small pit.
Root growth and development
2
New scale
Ranking Score (sum of VS rankings) Max =52
Piloting of the new VSA methodology.
This exercise was conducted by members of the implementation in conjunction with Palesa Motaung,
An M. Agric studentform the University of Pretoria, being supportedin her fieldwork through this
research process.
The assessments were done for 5participants in Stulwane, who have been participating in the CA
programme for 4-5 years: Thulani Dlamini, Khulekani Dladla, Makhethi Dladla, Cuphile Buthelezi and
Mtholeni Buthelezi
Below are a few photographs indicative of the VS assessment and sampling process
Above Left-Right: Doing the bulk density test using a knife blade. A clod ofearth showing good aggregation, organic
matter and fine root system. A soil sausage showing the high clay content of the soil.

56
Above left to right: Examples of the shatter test for soil structure –showing good soil structure; with porous loos soil
with irregular aggregates of a dark colour indicate of higher organic matter –an intermediate or moderate soil structure
–With a larger proportion of clods that break up into unaggregated soil, but also larger clods staying intact and Poor
Soil structure with a large clod showing very little root penetration and few macro pores.
The small table below summarises the new VSA methodology results for the five participants. This
approach appears to be a lot more promising and will be further explored during this growing season.
An important consideration, not taken into account previously is that the soils have to be moist when
these tests are conducted. Dry soils andespecially those in higher clay soils will show “signs” of
compaction under dry conditions, regardless of the condition of the soil.
Table 23: VSA scores using the new methodology for 5 participants in Stulwane, November 2018.
The veld samples are considered to be high benchmarks tocompare the croppingplots against.
Sampled plots (from the CA trial plots) were two maize only plots and two maize and beans plots for
each participant. From the table above the following observations can be made:
The score ranges are:
VSA Score
Name and Surname
CA Maize
CA Maize + Beans
Veld
Mthuleni Dlamini
40
24,5
41
Khulekani Ddladla
34,5
31,5
27
Makhethi Dladla
25
33
34
Cuphile Buthelezi
28
30
37
Thulani Dlamini
31
26,5
39

57
Visual Soil Quality Assessment
Ranking score
Poor
0-20
Moderate
21-35
Good
36-52
•For the veld samples, even though they are meant to be high benchmarks only 3 of the 5
samples can be considered good under the VS assessment. This means that soil conditions
generally in the Bergville area tend towards compaction, lack of soil aggregation and low to
medium organic matter, even in undisturbed soils.
•The farmer who has been the most successful in changing his soils for the better through his
CA implementation is Kulekani Dladla, where the results for both his CA Maize only and CA
maize and bean intercropped plots are higher than the veld benchmark, although the overall
rating is still considered as moderate. In real terms this is a significant outcome- being able
to improve soils’ health and structure above that of the surrounding veld.
•For three of the five farmers their VS assessment is higher for their CA maize plots than their
CA Maize and Bean intercropped plots.
•Soil characteristics that gave similar scores across the different farmers and plots are soil
surface texture and soil depth. This points towards the general compaction of soils in the
area and slow build -up of organic matter, even in the CA plots.
•Soil characteristics that differed between farmers and their different trial plots include soil
structure (aggregates), soil porosity and bulk density. This indicates that these soil
characteristics are being affected positively through the CA cropping practices.
•There were zero earthworm counts throughout the whole system, including the veld plots.
The re-orientedVSA process is much more able to provide a qualitative assessment of individual’s
fields and the effect of their cropping practices on their soil characteristics.
8. Work Plan
Deliverables Still to to be completed in the forthcoming years (2019-2021) are summarised below
Table 24: Work plan for 2019-2021
FINANCIAL YEAR 2019/2020
8
Report: Appropriate
quantitative
measurement
procedures for
verification of the
visual indicators.
Set up farmer and researcher level experimentation. Link
proxies and benchmarks to quantitative research to verify
and formalise. Explore potential incentive schemes and
financing mechanisms.Conduct survey of present
knowledge mediation processes in community and
smallholder settings???
1 August
2019

58
9
Interim report: results
of pilots, season 2
Pilot chosen collaborative strategies for introduction of a
range of CSA and WSC strategies, working with the CoPs
in each site and the decisions support system. Create
knowledge mediation productions, manuals,
handouts and other resources necessary for learning
and implementation.
31 January
2020
FINANCIAL YEAR 2020/2021
10
Final report: Results of
pilots, season
Pilot chosen collaborative strategies for introduction of a
range of CSA and WSC strategies, working with the CoPs
in each site and the decisions support system. Create
knowledge mediation productions, manuals, handouts
and other resources necessary for learning and
implementation.
1 May
2020
11
Final Report:
Consolidation and
finalisation of decision
support system
Finalisation of criteria and practices, introduction of
new ideas and innovations, updating of decision
support system
3 July
2020
12
Final report -
Summarise and
disseminate
recommendations for
best practice options.
Summarise and disseminate recommendations for
best practice options for knowledge mediation and CSA
and SWC techniques for prioritized bioclimatic regions
7 August
2020
In addition, the following activities are to be given attention
Theme
Activities
Practices
Inclusion of more practices in the 1pagers
Initial web design and online survey for the DSS
Exploration of potential practices (more expertise and refinement required); spring
protection, furrow irrigation, improved irrigation practices, windbreaks, fodder
production, crop calendars, seed saving, drought and bird resistant varieties,
Knowledge mediation products: Manuals, learning materials, participatory video
Process
Ongoing facilitation (learning, mentoring and monitoring) process to be conducted
with the 7 established learning groups across three provinces
Strengthening of stakeholder CoPs. Set up of learning and sharing events.
Dissemination workshops
Monitoring and
Evaluation
Participatory impact assessments in all provinces, with the next round of CSA
implementation
Continue write up monitoring results (Quantitative and qualitative); summer (CA and
winter (gardening)
Final assessment of appropriate visual indicators
Recommendations; including Pes systems,

59
9. Capacity building
Capacity building has been undertaken on three levels:
•Community level learning
•Organisational capacity building
•Post graduate students
9.1 Community level learning
This has been discussed at length in previous sections. In summary,learning workshop have benen
conducted in 9 villages across three provinces (EC, KZN and Limpopo) with a total of 250 participants
including a number of topicsincluding; scientific and community level understanding of climate
change and weather variability, impact of climatechange on production, adaptive measures,
introduction to a range of CSA practices, farmer level experimentation and practical learning for a
range of CSA practices. Some of the themes for learning workshops and demonstrations were:
•Tunnel construction and installation, use and maintenance of bucket dripkits (Bergville,
Madzikane, Turkey)
•Use of measurements in tunnel experimentation process; including rain gauges and
chameleon water sensors and procedures for measuring amounts of irrigation and harvests
(Sedawa, Ezibomvini, Mhlwazini)
•Soil fertility management using trench beds, shallow trenches and eco-circle beds (Bergville,
Swayimane, Turkey
•Building and maintaining tower gardens for greywater management (Turkey, Dimbaza,
Swayimane, Ezibomvini, Mhlwazini, Thamela)
•Spring protection and reticulation of water form springs and boreholes (Lepelle, Sedawa,
Turkey, Ezibomvini and Eqeleni) and
•Fodder production and management (incl fodder species, supplementation, making and
baling hay) (Stulwane, Ezibomvini and Eqeleni)
9.2 Organisational capacity building
Within 3 NGOs (MDF, Lima RDf and AWARD) capacity of field staff to facilitate and work with climate
change concepts and facilitation of CSA at community level has been enhanced through:
Collaborative design of workshop outlines and facilitation processes:
•Training sessions in CC and CSA facilitation, including appropriate CSA practices
•Mentored facilitation of CC and CSA workshops
•Field staff managed facilitation of learning events
•Participatory impact assessments
•Setting up of CoPs and
•Attendance at stakeholder CoP processes related to this work (Agroecology network in
Limpopo, Rangelandmanagement cross visit with UCPP in Eastern Cape and regenerative
agriculture symposium in the Free State.
9.3 Post graduate students
Two students that have been registered under this project have left:

60
1. Sylvester Selala: PhD in Hydrology (UKZN). He never completed his concept proposal
and after two years of re-conceptualising his concept opted not to register for a
doctorate. He felt that his topic of developing proxy and visual indicators and
benchmarks for monitoring of CSA processes was too risky as an option and may not
easily be completed within 1-2 years. He left the employ of MDF to pursue a business
opportunity in financial management services.
2. Khethiwe Mthethwa: She was registered for an MSC in rural resource Management,
but left the programme after her first year, having received full time employment
under the Umgeni Resilience Programme, managed by UKZN. In addition, UKZN only
provides 1 year of bursaries for Masters degrees and she did not want to continue
with the study withouta full bursary. She did not acceptthe payment of fees and
support for field work offered through this project.
Progress with theses: Field work and initial reporting
1. Palesa Motaung:MAgric -University of Pretoria. Evaluating the restorative effect of
conservation agriculture on the degraded soilsof the upper Drakensburg area of Bergville,
KwaZulu-Natal using qualitative versus quantitative soil health indicators
2. Mazwi Dlamini: MPhil -UWC_PLAAS. Factors influencing the adoption and non-adoption of
Conservation Agriculture in smallholder farming systems, and the implications of these for
livelihoods and food security in Bergville, Kwazulu-Natal
Progress: Initial proposals and research methodology
1. Samukhelisiwe Mkhize: PhD Human Sciences –UKZN; January 2019. An investigation into the
factors limiting and promoting the adoption of CSA in smallholder systems in South Africa.
10. Publications and networking
Publications
➢SA Grain Newsletter; CA SFIP, 1 smallholder case study (Swayimane)
Cross visits
➢PACSA –small livestock production interventions in the Umgungundlovu DM
➢INR_ Agroforestry implementation and progress
Attendance
➢No-Till Club Annual Conference- 4-6 September 2018
➢KZN CA Forum
➢Introduction of Agricloud app (www.rain4africa.org) for smallholder farmers –ARC

61
Presentations
➢Land RehabilitationSociety of South Africa:Annual Conference 13-15 August 2018. Presentation
of a paper “Learning CA the Innovation Systems Way”– E Kruger
➢8th Biennial LandCare Conference; 25-27 September “CA Innovation Systems; progress and
successes” – T Mathebula
➢2ACCA: Learning Conservation Agriculture the Innovation Systems way _E Kruger (2 October 2018)
and Soil Health improvements in smallholder CA systems _E Kruger (3 October 2018)
➢Agroecology Network: Decision Support System for CSA for smallholder farmers in SA _Catherine
van den Hoof (22 November 2018) and Best practices incommunity based climate change
adaptation _E Kruger (22 November 2018)
➢National Climate change Committee Stakeholder Meeting: Community based climate smart
agriculture _E Kruger (11 November 2018)
➢Farmers Days: Joint open day events for Conservation Agriculture with LandCare and KZNDARD in
Nokweja (SKZN), Stulwane- Bergville (KZN), Swayimane and Appelbosch (Midlands-KZN)
➢Agroecology network: Farmer level CSA practices cross visit, demonstrations and presentations
(12 March 2018)
Awards
➢2ACCA conference;
Conservation Agriculture
Champion award
➢LandCare; Best Civil Society
Organisation in LandCare
award.