Water Research Commission
Prepared By:
Project team led by Mahlathini Development Foundation.
Project Number: K5/2719/4
Project Title: Collaborative knowledge creation and mediation strategies for the dissemination of
Waterand Soil Conservation practices and Climate Smart Agriculture in smallholder farming
systems.
Deliverable No.6:Interim report: Results of pilots; Season 1
Date: January 2019
Deliverable
6

WRC K4/2719 Deliverable 5: Interim report; Refined decision support system for smallholder CSA-October 2018
2
Submitted to:
Executive Manager: Water Utilisation in Agriculture
Water Research Commission
Pretoria
Project team:
Mahlathini Development Foundation
Erna Kruger
Mazwi Dlamini
Samukelisiwe Mkhize
Temakholo Mathebula
Phumzile Ngcobo
Catherine van den Hoof
Institute of Natural Resources NPC
Jon McCosh
Rural Integrated Engineering (Pty) Ltd
Christiaan Stymie
Rhodes University Environmental Learning Research Centre
Lawrence Sisitka

WRC K4/2719 Deliverable 5: Interim report; Refined decision support system for smallholder CSA-October 2018
3
CONTENTS
FIGURES 4
TABLES 5
1OVERVIEW OF PROJECT AND DELIVERABLE6
Contract Summary6
Project objectives6
Deliverables 6
Overview of Deliverable 67
2Cops and demonStration sites continued10
2.1CCA workshop 111
2.1.1CCA workshop 1 summary –Madzikane _SKZN11
2.2CCA Workshop 2 and 3 –Swayimane_SKZN 20
2.2.1SWAYIMANE-GOBIZEMBE WRC WORKSHOP 2: PLANNING AND PRIORITIZATION,WORKSHOP 3:
EXPIRIMENTATION 20
2.2.2SECTION 1: WORKSHOP 2: PLANNING AND PRIORITISATION OF PRACTICES21
2.2.3SECTION 2: WORKSHOP 3: EXPERIMENTATION24
2.3CCA workshop 4 and 526
2.3.1Ntabamhlophe (Estcourt-KZN)26
2.3.2Alice/King Williams Town- EC 32
2.3.3Eqeleni and Ezibomvini –Bergville- KZN42
2.3.4Sedawa, Turkey- Mametja- Limpopo45
3NEW EMPHASIS: Water issues55
3.1Water issues follow-up- Limpopo55
3.1.1 Lepelle55
3.1.2 Sedawa55
3.1.3 Turkey56
3.2Water issues follow-up –Bergville 56
3.2.1 Ezibomvini56
3.2.2 Eqeleni……. 58
4CSA practices / Decision support system61
4.1Development of DSS61
4.2 Conceptual framework61
4.3DSS inputs62
4.3.1Physical environment62
4.3.2Farming systems67
4.3.3Farmer socio-economic background67
4.3.4Resources and management strategies69
4.3.5Agricultural practices70
4.4DSS processes and intermediate steps70
4.4.1Defining resources to manage based on physical environment and farming systems70
4.4.2Suggesting management practices based on resources to manage71
4.4.3 Confining suggested practice based on restrictions set by the farmer’s socio-economic
background, the farming system and the environmental conditions73
4.4.4Ranking relevant practices based on farmer and facilitator input75
4.5Implementation of DSS in Excel77
4.5.1 “DSS_input” sheet77
4.5.2 “Typology” sheet79
4.5.3 “Resources to manage” sheet79
4.5.4 “Tab pract. vs res.” sheet81
4.5.5 “Tab pract. vs constrains” sheet81
4.5.6 “Tab score facilitator” sheet81
4.5.7 “Tab score farmers” sheet81
WRC K4/2719 Deliverable 5: Interim report; Refined decision support system for smallholder CSA-October 2018
4
4.5.8 “Example for HH1” sheet81
4.6Case study for 26 households in South Africa82
4.6.1Description and analysis of DSS input for 26 households82
4.6.2DSS intermediate and final outputs description and analysis83
4.7Conclusion, further work and limitations of the DSS89
4.8Appendix A: Benefits and requirements for management practices90
4.9 References96
5Quantitative measurements for moNItoring impact97
5.1Measurements report Bergville (KZN)98
5.1.1Visual/ Qualitative Assessments98
5.2Quantitative assessments/ measurements104
5.2.1Approaches and methodology104
5.3Results and discussion111
5.3.1Results (bulk density)111
5.3.2Results (rainfall data)112
5.3.3Results (runoff)113
5.3.4Results (Infiltration)114
5.3.5Gravimetric soil water content results and discussion117
5.3.6Results (Water Productivity in Conservation Agriculture fields)119
5.3.7Water Productivity results and discussion; Method 1122
5.4Water productivity for gardening systems125
128
5.4.1Chameleon Results for the cropping period inside and outside the tunnels128
6Capacity building and publications131
6.1Post graduate students131
FIGURES
Figure 1:Left; the graph indicates thepercentage of participants using each of the 5 springs
mentioned. And Right:The graph indicates the percentage of participantswho have access to the
different water provision options in the villages (springs, community taps and boreholes)......... Error!
Bookmark not defined.
Figure 2: The picture alongside outlines the proposed extent of the supplyError! Bookmark not
defined.
Figure 3: Schematic ofthe Decision SupportSystem (DSS),with model inputs highlighted in grey.
................................................................................................................. Error! Bookmark not defined.
Figure 4: Components, proxies and sub-categories of the physical environment.Error! Bookmark not
defined.
Figure 5: Soil texture triangle................................................................... Error! Bookmark not defined.
Figure 6: Resources and related management strategies....................... Error! Bookmark not defined.
Figure 7: Summary of CA adoption for 4th and 5th season participants July 2018.Error! Bookmark not
defined.
Figure 8: Comparison of soil health test results for 2nd and 4th year CA participantsError! Bookmark
not defined.
Figure 9: From Left to Right: A spade of her soil graded to show large clods but little structural integrity;
An example of root size and depth of one of her maize plant -showingquite shallow rooting and the
double ring infiltrometer set up for readings.......................................... Error! Bookmark not defined.
Figure 10: Percentage implementation of new interventions and new innovations for a selection of
participants from 3 villages; July-September 2018.................................. Error! Bookmark not defined.

WRC K4/2719 Deliverable 5: Interim report; Refined decision support system for smallholder CSA-October 2018
5
Figure 11: Percentage implementation of local good practices for a selection of participants from 3
villages; July-September 2018 .................................................................Error! Bookmark not defined.
Figure 12: The gravimetric soil water content for Koko Maphori’s CA plot in Sedawa at 30,60,90 and
120cm depth............................................................................................ Error! Bookmark not defined.
Figure 13: Soil water content: Christina’s trench bed inside the tunnel (1 September2018)........ Error!
Bookmark not defined.
Figure 14: Soil water content; Christina’s furrows-and ridges (traditional beds or control).......... Error!
Bookmark not defined.
Figure 15: Soil water content: Christina’s trench bed outside the tunnelError! Bookmark not defined.
Figure 16: Soil Water content; Norah Mahlako -trench bed inside tunnelError! Bookmark not
defined.
Figure 17: Soil Water Content; Norah Mahlako- trench bed outside the tunnelError!Bookmark not
defined.
Figure 18: Soil water content; Mariam Malephe-trench bed inside the tunnelError! Bookmark not
defined.
Figure 19: Soil Water Content: Mariam Malephe- trench bed outside the tunnelError! Bookmark not
defined.
Figure 20: Soil fertility analysis results for four villages in Limpopo........ Error! Bookmark not defined.
TABLES
Table 1: Deliverables for the research period; completed.....................................................................6
Table 2: CoPs’ established in three provinces (May-September 2018)................................................10
Table 3: Gobizembe analysis of farming system; Past, present and futureError!Bookmark not
defined.
Table 4: Analysis of potential adaptive measures to counteract CC Impacts; Swayimane ............ Error!
Bookmark not defined.
Table 5: Prioritization matrix for Gobizembe participants ...................... Error! Bookmark not defined.
Table 6: Crops yields in CA trials in Swayimane; 2017-2018 ................... Error! Bookmark not defined.
Table 7: Summarised points from the discussion of introduction of Conservation Agriculture in
Swayimane............................................................................................... Error! Bookmark not defined.
Table 8: Description of all water sources, as used by each participant in the workshop............... Error!
Bookmark not defined.
Table 9: Eqeleni; details of water sources per participant...................... Error! Bookmark not defined.
Table 10: Agro-Ecological Zones encountered in South Africa (grey) and location of study sites within
these zones.............................................................................................. Error! Bookmark not defined.
Table 11: Socio-economic characteristics and rangeof values used to define the three typologies
................................................................................................................. Error! Bookmark not defined.
Table 12:Criteria for defining the resources to manage and related strategies, based on the physical
environment and farming system (grey boxes) (*:solely for semiarid zone)Error!Bookmark not
defined.
Table 13: Criteria for selecting practices based on the resources to manage and related strategies (grey
boxes)....................................................................................................... Error! Bookmark not defined.
Table 14: Criteria for confining the selected practices based on farmer typology, physical environment
and farming system (grey boxes)............................................................. Error! Bookmark not defined.

WRC K4/2719 Deliverable 5: Interim report; Refined decision support system for smallholder CSA-October 2018
6
Table 15: Scores, between 0 and 3 assigned by a facilitator to each resource andper practicebased on
the estimated beneficial impact of the practice on the specific resourceError! Bookmark notdefined.
Table 16: CSA practices prioritized by individual participants................. Error! Bookmark not defined.
Table 17: Individual farmer led experimentation choices; EC, Aug 2018Error! Bookmark not defined.
Table 18:Innovation Systems indicators for the CA-SFIP in Bergville...... Error! Bookmark not defined.
Table 19: Crop yields in CA farmer-led trials in Bergville; 2013-2017..... Error! Bookmark not defined.
Table 20: Bulk density results for three CA participants.......................... Error! Bookmark not defined.
Table 21: Run-off data from Phumelele Hlongwane; 2016-2017............ Error! Bookmark not defined.
Table 22: Summary of water infiltration results for 13 participants in Bergville; 2017-2018........ Error!
Bookmark not defined.
Table 23: Participants in quantitative measurements for trials; KZN, Limpopo and EC: September 2018
................................................................................................................. Error! Bookmark not defined.
Table 24: Rainfall records from 4 standard rain gauges in Sedawa, Mametja and Botshableo..... Error!
Bookmark not defined.
Table 25: Water productivity calculations for the gardening system farmer led experiments...... Error!
Bookmark not defined.

WRC K4/2719 Deliverable 5: Interim report; Refined decision support system for smallholder CSA-October 2018
7
Interimreport:Refineddecisionsupport
systemforCSAinsmallholderfarming
1OVERVIEW OF PROJECT AND DELIVERABLE
Contract Summary
Project objectives
1. To evaluate and identify best practice options for CSA and Soil and Water Conservation
(SWC) in smallholder farming systems, in two bioclimatic regions in South Africa. (Output 1)
2. To amplify collaborative knowledge creation of CSA practices with smallholder farmers in
South Africa (Output 2)
3. To test and adapt existing CSA decision support systems (DSS) for the South Africansmallholder
context (Outputs 2,3)
4. To evaluate the impact of CSA interventions identified through the DSS by pilotinginterventions
in smallholder farmer systems, considering water productivity, social acceptability andfarm-scale
resilience (Outputs 3,4)
5. Visual and proxy indicators appropriate for a Payment for Ecosystems based model aretested at
community level for local assessment of progress and tested against field and laboratory analysis
of soil physical and chemical properties, and water productivity (Output 5)
Deliverables
Table 1: Deliverables for the research period; completed
No
Deliverable
Description
Target date
FINANCIAL YEAR 2017/2018
1
Report: Desktop review of
CSA and WSC
Desktop review of current science, indigenous and traditional
knowledge, and best practice in relation to CSA and WSC in the
South African context
1 June 2017
2
Report on stakeholder
engagement and case
study development and
site identification
Identifying and engaging with projects and stakeholders
implementing CSA and WSC processes and capturing case studies
applicable to prioritized bioclimatic regions
Identification of pilot research sites
1 September
2017
3
Decision support system
for CSA in smallholder
farming developed
(Report)
Decision support system for prioritization of best bet CSA options in
a particular locality; initial database and models. Review existing
models, in conjunction with stakeholder discussions for initial
criteria
15 January
2018
FINANCIAL YEAR: 2018/2019
4
CoPs and demonstration
sites established (report)
Establish communities of practice (CoP)s including stakeholders and
smallholder farmers in each bioclimatic region.5. With each CoP,
identify and select demonstration sites in each bioclimatic region
and pilot chosen collaborative strategies for introduction of a range
of CSA and WSC strategies in homestead farming systems (gardens
and fields)
1 May 2018
5
Interim report: Refined
decision support system
for CSA in smallholder
farming (report)
Refinement of criteria and practices, introduction of new ideas and
innovations, updating of decision support system
1 October
2018
6
Interim report: Results of
pilots, season 1
Pilot chosen collaborative strategies for introduction of a range of
CSA and WSC strategies, working with the CoPs in each site and the
decisions support system. Create knowledge mediation productions,
31 January
2019

WRC K4/2719 Deliverable 5: Interim report; Refined decision support system for smallholder CSA-October 2018
8
manuals, handouts and other resources necessary for learning and
implementation.
FINANCIAL YEAR 2019/2020
7
Report: Appropriate
quantitative measurement
procedures for verification
of the visual indicators.
Set up farmer and researcher level experimentation
1 May 2019
8
Interim report:
Development of indicators,
proxies and benchmarks
and knowledge mediation
processes
Document and record appropriate visual indicators and proxies for
community level assessment, work with CoPs to implement and
refine indicators. Link proxies and benchmarks to quantitative
research to verify and formalise. Explore potential incentive
schemes and financing mechanisms.
Analysis of contemporary approaches to collaborative knowledge
creation within the agricultural sector. Conduct survey of present
knowledge mediation processes in community and smallholder
settings. Develop appropriate knowledge mediation processes for
each CoP. Develop CoP decision support systems
1 August
2019
9
Interim report: results of
pilots, season 2
Pilot chosen collaborative strategies for introduction of a range of
CSA and WSC strategies, working with the CoPs in each site and the
decisions support system. Create knowledge mediation productions,
manuals, handouts and other resources necessary for learning and
implementation.
31 January
2020
FINANCIAL YEAR 2020/2021
10
Final report: Results of
pilots, season
Pilot chosen collaborative strategies for introduction of a range of
CSA and WSC strategies , working with the CoPs in each site and the
decisions support system. Create knowledge mediation productions,
manuals, handouts and other resources necessary for learning and
implementation.
1 May 2020
11
Final Report: Consolidation
and finalisation of decision
support system
Finalisation of criteria and practices, introduction of new ideas and
innovations, updating of decision support system
3 July 2020
12
Final report - Summarise
and disseminate
recommendations for best
practice options.
Summarise and disseminate recommendations for best practice
options for knowledge mediation and CSA and SWC techniques for
prioritized bioclimatic regions
7 August
2020
Overview of Deliverable 6
This report deals with the piloting of the collaborative strategies across the three sites in Limpopo,
KZN and EC. Progress with the decision support system is also detailed. It also includes some of the
quantitative measurement procedures and some work on visual indicators, as well as farmer level
experimentation. Some of these results cover the requirements of Deliverable 7. In the next 5 months
the manuals, handouts and resources will be given more attentionto bring these products to a level
of quality that can be presented and published. Work on these is presently ongoing and not reported
here.
The design of the decision support system(DSS)is seen as an ongoing process divided into three
distinct parts:
➢Practices: Collation, review, testing, and finalisation of those CSA practices to be included.
Allows for new ideas and local practices to be included over time. This also includes linkages
and reference to externalsources of technical information around climate change, soils, water
management etc and how this will be done, as well as modelling of the DSS;
➢Process: Through which climate smart agricultural practices are implemented at smallholder
farmer level. This also includes the facilitation component,communities of practice(CoPs),
communication strategies and capacity building and
➢Monitoring and evaluation:local and visual assessment protocols for assessing
implementation and impact ofpracticesas well as processes used. This also includes site

WRC K4/2719 Deliverable 5: Interim report; Refined decision support system for smallholder CSA-October 2018
9
selection and quantitativemeasurements undertaken tosupport the visual assessment
protocols and development of visual and proxy indicators for future use in inactive based
support schemes for smallholder farmers.
Activities in this four- month period have included:
➢Practices activities: continue modelling of the DSS and run the model for 26 households across
three provinces.
➢Process activities:Conduct CCA workshops 2and 3in Swayimane (KZN), CCA workshops 1 and
2 in Madzikane (KZN), as well as training and implementation (Workshop 4) in the EC (3
villages), and monitoring of implementation in Bergville and Ntabamhlophe in KZN. CoP
engagement has consisted of presentations atthe 2nd African Conference on Conservation
Agriculture (2ACCA), the NCCC and a CSA best practice session for the Agroecology network.
➢Monitoring and evaluation:First round of quantitative measurement of indicators (weather
stations, run-off plots, gravimetric soil sampling, soil health sampling, soil fertility sampling,
chameleon water sensors) for conservation agriculture (CA) and intensive gardening activities
in one site; Bergville, redesign of methodology for visual soil assessments and redesign of
garden monitoring process
A chronology of activities undertaken is presented in the table below.
Date
Activity
Description
Team
2018/09/18-19
CCA workshop 1
Initiation of process in Madzikane -
SKZN
Mazwi, Samukhelisiwe,
Khethiwe
2018/10/02-03
Presentations and
attendance
2nd African Conference in Conservation
Agriculture –Gauteng
Erna, Phumzile, Tema,
Khethiwe, Samukhelisiwe
2018/10/04
CCA W/s 5 –
Limpopo
Review and re-planning workshop for
village clusters in Limpopo
Erna, Sylvester, Betty
2018/11/07,15
CCA Ws 2 and 3 –
Swayimane
Continuation of the CCA process in
Gobizembe- Swayimane –SKZN
Tema, Samukhelisiwe
2018/11/11
Presentation
NCCC stakeholder w/s- Gauteng
Erna
2018/11/14-15
CCA Ws 4
Ntabamhlophe –
KZN
Review of implementation in
gardening practices and tunnels
Samukhelisiwe, Khethiwe
and Lindelwa (Lima-RDF)
2018/11/20-21
Training and
mentoring
Traditional and local poultry
production systems in a changing
environment –Limpopo (5 villages)
Erna, Mazwi, Sylvester,
Nonkhanyiso, Betty, Andries
2018/11/22
Organise and
present
2nd Agroecology network meeting;
Best practice in CSA –Nelspruit,
Limpopo
Erna, Catherine van den
Hoof, Lawrence, Betty
2018/12/04-07
CCA W/s 4 EC
Implementation and monitoring
workshops for 3 villages in the EC
Mazwi, Khethiwe, Lawrence
2018/12/04-07
CCA W/s 5 and
monitoring
Bergville KZN
Implementation monitoring and
sharing events in Eizbomvini and
Eqeleni
Samkhe, Phumzile
2018/12/12
CCA W/s 5
Ntabamhlophe-KZN
Demonstration of CA with new
experimentation cycle
Samukhelisiwe, Khethiwe
and Lindelwa (Lima-RDF)

WRC K4/2719 Deliverable 5: Interim report; Refined decision support system for smallholder CSA-October 2018
10
Capacity building and publications:
•Research presentations and chapters:
oMazwi Dlamini –M Phil (PLAAS UWC-yr 2); Completed research tools and started on
field work
oSamukelisiwe Mkhize
•Publications: -
•Cross visits:
oINR_ Agroforestry implementation and progress
•Attendance: -
•Conference papers and presentations:
o2ACCA: Learning Conservation Agriculture the Innovation Systems way _E Kruger (2
October 2018) and Soil Health improvements in smallholder CA systems _E Kruger (3
October 2018)
oAgroecology Network: Decision Support System for CSA for smallholder farmers in SA
_Catherine van den Hoof (22 November 2018) andBest practices in community based
climate change adaptation _E Kruger (22 November 2018)
oNational Climate change Committee Stakeholder Meeting: Community based climate
smart agriculture _E Kruger (11 November 2018)
oFarmers Days: Joint open day events for Conservation Agriculture with LandCare and
KZNDARD in Nokweja (SKZN), Stulwane-Bergville (KZN), Swayimane and Appelbosch
(Midlands-KZN)
•Awards:
o2ACCA conference; Conservation Agriculture Champion award
oLandCare; Best Civil Society Organisation in LandCare award.

WRC K4/2719 Deliverable 5: Interim report; Refined decision support system for smallholder CSA-October 2018
11
2COPS AND DEMONSTRATION SITES CONTINUED
The work with the CoPs and in the demonstration sites is ongoing. The table below summarises the
progress to date.
Table 2: CoPs’ established in three provinces (October 2018-January 2019)
*Note: Activities in bold under Demonstration Sites, were conducted during this time frame
Province
Site/Area;
villages
Demonstration
sites
CoPs
Collaborative strategies
KZN
Ntabamhlophe
- CCA workshop 1
- CCA workshop 2
-CCA workshop 3
-CCA workshop 4
-CCA workshop 5
-Farmers w NGO
support (Lima RDF)
- Tunnels and drip kits
- Individual experimentation with
basket of options
Ezibomvini/
, Eqeleni
- CCA workshop 1
- CCA workshop 2
- CCA workshop 3
- CCA workshop 4
(training)
- Water issues
workshops 1,2
-Water issues follow-
up
-CCA workshop 5
-CA open days, cross
visits (LandCare,
DARD, ARC, GrainSA),
LM Agric forums, ….
- Tunnels (Quantitative
measurements
- CA farmer experimentation
(Quantitative measurements) –case
studies
-Individual experimentation with
basket of options; monitoring review
and re-planning
Swayimane
- CCA workshop 1
-CCA workshops 2 and
3
-CA open days
-Umgungundlovu DM
agriculture forum
-CA farmer experimentation
- gardening level experimentation;
tunnel, trench beds drip kits etc.
Madzikane
-CCA workshop 1
-CA open days
- Madzikane
stakeholder forum
-CA farmer experimentation
- gardening level experimentation;
tunnel, trench beds drip kits etc
Limpopo
Mametja (Sedawa,
Turkey)
- CCA workshop 1
- CCA workshop 2
- CCA workshop 3
- CCA workshop 4
-Water issues
workshops 1-2
-Water issues follow-
up
-CCA workshop 5
- Poultry production
learning and
mentoring
-Agroecology
network
(AWARD/MDF)
-Maruleng DM
-Review of CSA implementation and
re-planning for next season
Tunnels (Quantitative measurements
- CA farmer experimentation
(Quantitative measurements) –case
studies
- Individual experimentation with
basket of options
-water committee, plan for agric
water provision
Lepelle
Water issues
workshops 1-2
-
-water committee, plan for agric
water provision
Tzaneen
(Sekororo-
Lourene)
- CCA workshop 1
- CCA workshop 2
- Assessment of farmer
experimentation
Farmers learning
group
-Tunnels and drip kits
EC
Alice/Middledrift
area
- CCA workshop 1
- CCA workshop 2
- CCA workshop 3
-CCA workshop 4 and
5
Imvotho Bubomi
Learning Network
(IBLN) - ERLC, Fort
Cox, Farmers, Agric
Extension services,
NGOs
- Monitoring and review of
implementation of CSA practices and
experimentation
- Training and mentoring _CA, furrow
irrigation, ….
-Planning for further implementation
and experimentation and
quantitative measurements

WRC K4/2719 Deliverable 5: Interim report; Refined decision support system for smallholder CSA-October 2018
12
CCA workshop 1
The idea is both to continue the implementation and experimentation with a basket of CSA options in
theexisting seven (7) villages and to introduce the process in new villages, to practice and refine the
decision support methodology being used in different contexts.
The climate change adaptation process was expanded into one more village, in Southern KZNduring
this period -Southern KZN –Madzikane (Creighton).
In accordance with the capacity development process for staff and interns, these workshops are now
facilitated and recorded entirely by the teams themselves. They have made a few interesting
adaptations to the facilitation process, which will be incorporated into the overall methodology.
Reports are included here with minimal editing, to showcase their work and progress.
CCA workshop 1 summary –Madzikane _SKZN
Written by Mazwi Dlamini and Samukelisiwe Mkhize
On the 18th September 2018 the Mahlathini Development Foundation team (Mazwi Dlamini, Zanani
Mzila andSamukelisiwe Mkhize) held a workshop with fifteen participants (12 women and 3 men). On
day two of the workshop, this team (along with Temakholo Mathebula and Sandile Madlala) returned
to find twenty participants (16 womenand 4 men). According to the participants, the new participants
heard about the workshop and
decided to join to learn about
climate change and its effectson
their future farmingpractices and
possible adaptation practices.
Figure 1: The pie chart shows the
participation disparity between men and
women on day 1 & 2 of the workshop.
Day One –18th September 2018
Farmers understanding of climate change and its effect on their farming activities and
livelihoods.
Participants’understandingof climate change is related to their experiences of increasing climate
extremities and variability. According to participants there have been several incidents of climatic
changes and variability that have been taking place over the years in Madzikane. During the discussion,
participants mentioned that they have witnessed and experienced the following changes in climate
over the years that have ‘confirmed’ to them that climate change is indeed taking place:
➢Change in rainfall patterns (rain coming later than expected) leading to shifting of planting
dates
➢Shorter but heavy rainfall periods leading to soil erosion
WRC K4/2719 Deliverable 5: Interim report; Refined decision support system for smallholder CSA-October 2018
13
➢Increasingly hot temperatures
➢Stronger winds breaking maize stalks
➢Frosting in September
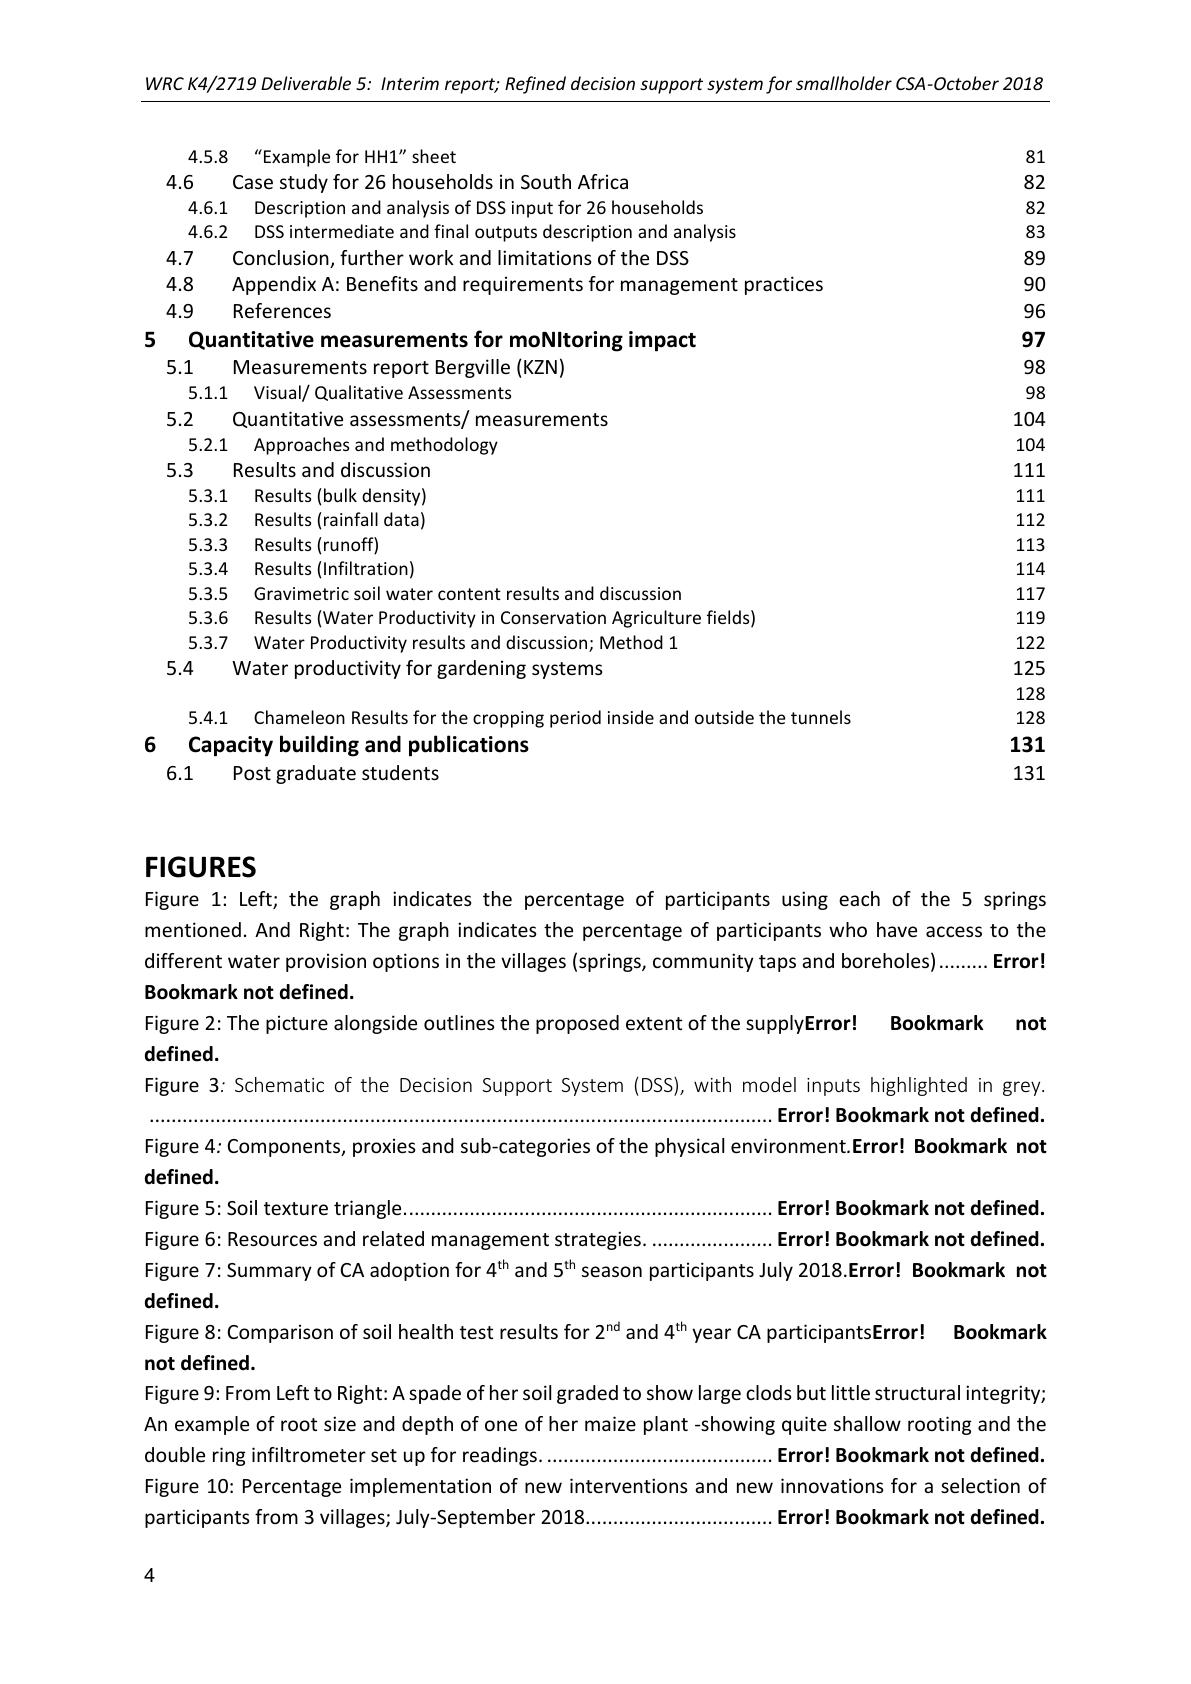
To broaden participants understanding of how climate change and variabilityaffect their farming
practices and livelihoods participants were asked to pick the most important component between soil,
sun and rain, relatedto their farmingpractices. This ledto an interesting debate amongst participants,
where some agreed that the most important component is the soil withothers insisting that all are
important because all three components contribute equally to good crop growth. One of the
participants explained that too much rain will result in stunted plants, fungus growth and poor crop
growth and too much sunlight/heat dries up vegetable plants. Therefore, they all later agreed that all
three are equally important and work together to ensure good crop growth, including the wind (see
Figure 2below). Mr Xaba (one of the participants) clarified that the customary understanding that soil
is the most important component stems from the idea thatparticipants believe and pray to God that
they will receive enough rainfall and sunlight from the Creator, so they focus on soil as the only
component they can ‘fix’.
Figure 2: An understanding of how soil, rain, heat and wind affect crop production is required to understand how
climate change impacts on current and future farming practices.
Challenges to farmers’ livelihoods:
Participants identifiedthe following impacts and challenges on their livelihoods as a consequenceof
climate variability and changes overtime:
➢Degrading veld for grazing
➢Drought (erratic rainfall patterns)
➢Water scarcity
➢Veld fires
➢Erosion
➢Pest and diseases
➢Flooding
RAIN
SUN
WIND
SOIL

WRC K4/2719 Deliverable 5: Interim report; Refined decision support system for smallholder CSA-October 2018
14
Above and Right: Participants discussing their experiences of climate
change.
Past, Present and Future livelihoods and farming
situations in relation to climate change
This part of the workshop focused on participants’ experiences and perceptions on past livelihoods
and farming situations, how these situations have changed in relation to climate change and what the
future situation will be, looking at current effects of climate change. Mazwi Dlamini illustrated the
difference between weather and the climate to participants, by posing this question to participants,
‘‘if a relative called to visit your home and asked whatthe weather will belikethat weekend, what
would your response be and why?” None of the participants could respond. He then explained that,
weather conditions are predictable unlike climate change and variabilities, weather stations predict
future weather conditions by looking at current and past weather patterns. Weather conditions can
change throughout the day/week, but climatic changes occur over a longer period of time. This
understandingenabled participants to recall cases of extreme climatevariabilitiesthat have taken
place in the community over the years and effects to their farming practices:
➢2016 - 2017 –Drought –Farmers achieved low yields during this period
➢1993 –Drought – Farmers couldn’t plant during this period because of the extensive drought
and dry soils.
➢1987 –Flooding
➢1959 –Flooding –Bridges washed away
by floods
Right: Mazwi showing participants illustrations
of past extreme climate variability and
outcomes in the Drakensberg

WRC K4/2719 Deliverable 5: Interim report; Refined decision support system for smallholder CSA-October 2018
15
The participants mentioned the following past, present and future conditions; summarised below.
Table 3: Past, present and future farming situations for the Madzikane farmers’ group
PAST CONDITIONS
PRESENT CONDITIONS
FUTURE CONDITIONS
Hot temperatures
Increasingly hot temperatures
during summer months
Temperatures will continue to increase
drying out vegetable plants (tomatoes,
green peppers)
Longer rain season
Shorter rainfall season and
frequent droughts
Less rain & no rain fall in some seasons
Strong winds
Frequent and stronger winds
that wreck peoples’ homes
Less water infiltration in soil
Low yields
Increased yields as a result of
sustainable agriculture practices
Yields will decrease if farmers do not act
against climate change
Tillage
No tillage and less use of
tractors
No tillage and hand planting
Livestock controlled and
regulated
No livestock control and
regulation
Fencing of farm fields tocontrol livestock
grazing
Mix cropping
Single cropping
Mixed cropping and intercropping
Hand weeding
Use of pesticides and herbicides
Increased use of pesticides and herbicides
Soil erosion due to flooding
Increasing incidences of floods
that lead to washing away of
seeds
Vast and increasing soil erosion that may
lead to farmers’ inability to farm
Large farm fields
Smaller farm fields
Even smaller farm fields
Climate change predictions
After the discussion on weather vs climate change, participants were equipped with the basic
understandingof climatic change and predictions, thereafter, participants were divided into two
groups to create maps of current rainfall and temperature patterns. This exercise is designed to give
farmers a possible idea of how climate change will effect temperatures and rainfall patterns.
Above left and right:One of the participants explaining rainfall patterns in Madzikaneand a small
group of participants creating their rainfall and temperature charts

WRC K4/2719 Deliverable 5: Interim report; Refined decision support system for smallholder CSA-October 2018
16
Table 4: The following temperature and rainfall predictions were recorded by participants:
Month
Rainfall pattern
Temperature
Farming practices
January
Low rainfall
Very hot
Vegetables dried out due to
droughts
February
Low rainfall
Hot
Beans
March
A partially rainy time of the year
but this has increased over the
years, leading to spoilt maize
before harvesting
Hot
A lot of rain during this month
affects maize growth.
But it’s a goodtime toplant
imfino and cabbage
April
Partial rainfall
Warm, not too hot
Raddish
May
No rain
Cold
Too cold to plant
June
No rain
Too cold to plant
July
No rain
Very cold
Too cold to plant
August
Some rain but relatively low
Very cold and windy
Plant potatoes till December
September
Rainfall gradually increases during
this time but still relatively low
Cold and some
cases of frosting
Some vegetable plants grown
during this time get frost bitten
October
Rainy time of the year
Hot
Potatoes
November
Rainfall increases during this
month of this time of the year
Hot
Maize & potatoes
December
High rainfall
Very hot
Maize & potatoes
Reality Maps
This part of the workshop was designed for participants to discuss and create mind maps of social,
environmental and
economic impacts climate
change will have on farmers’
livelihoods and farming. The
participants discussed and
drew up reality impact maps
on how the above
mentioned issuesand
problems impact their
farming as well as their
livelihoods.
Right: Reality Map created
by participants
Table 5: Points mentioned on the reality impact map by participants
Economic/Environme
ntal/Social problem
Economic/Environmental/Social
Impact
Solutions or adaptations
Degrading veld
-Less fertile veld areas for livestock
grazing,
- Starvation and dying of livestock
- Forced selling of livestock
-Increase need to supply feed to
livestock
Cover crops

WRC K4/2719 Deliverable 5: Interim report; Refined decision support system for smallholder CSA-October 2018
17
Strong winds, at
inappropriate times (no
longer in July)
- Breaking of maize stalks
-Increased evaporation that leads to
drying soils
No adaptation/solution identified
Very hot temperatures
- Dried up vegetable plants
- Increase in diseases
- Livestock skin diseases
No-till
Heavy rain at
inappropriate times
- Increased soil erosion
- Seeds get washed away
- Less yields
-Stunted plants and fungus growth on
crops
and poor crop growth
Contours, Ripping as opposed to
ploughing
Less rain during the
planting season
- Changing of planting seasons
- Less yields
- Stunted
Changing of planting dates
Drought
-Can’t irrigate fields and livestock suffers
from skin diseases
Drip kits
Untimely frosting
-Frost bitten tomatoes and green
peppers, butternut and
-Maize does not germinate in this
condition
No adaptation/solution mentioned
Livestock invasion into
farmers to graze
-Livestock invasion into farming fields
grazing on mulch, vegetables and crops
-Fencing farm fields and gardens
- Regulation of livestock grazing
Scarcity of water
-No water to irrigate home vegetable
gardens
-Installation of jojo tanks
Household visits
Household visits are undertaken to assess the present situation, undertake the baseline interviews
and look at local adaptations in the farming system
Right and Far right:
Mam’ Thengani
Shozi explaining to
farmers what was
planted in her
garden and Her
garden (100m2)
where she had
previously planted
different vegetables
and potatoes.
The team visited Mama Thengani Shozi a 46-year-old farmer from Madzikane to see her vegetable
garden (100m2) and field (0.2 ha), discuss current practices and challenges inrelation to climate
change.She had previously planted all kinds of vegetables in her garden including carrots, spinach,
cabbages, beetroot etc. planting them as seedlings. She produced her own seedlings. Currently, no

WRC K4/2719 Deliverable 5: Interim report; Refined decision support system for smallholder CSA-October 2018
18
vegetables have been planted due to lack of access to water to irrigate her plants, she has to walk a
very long distance to fetch water from the river. Her garden is divided into two sections, (1) vegetable
section planted in raised soil beds, (2) potatoes section planted in rows withfertilizer to speed up
plant growth. According Mam’ Shozi, she no longer uses fertilizer because she buys seedlings from
‘Sutherlands Nursery’ in Ixopo produced with a slow release fertilizer.
The farmers had established a co-operative in order to open up a nursery within Madzikane
community to assist local farmers to access seedlings close within the community instead of travel to
the Sutherlands Nursery which is very far from eMadzikane.
Right and far
right:
Participants
taking part in
the
household
visit
During the discussion, other participants shared that they prefer to use kraal manure instead of using
fertilizers through a process of digging holes, placing seedling(s) then applying micro doses of kraal
manure. Once the crop or plant begins toshow signs of vigorous growth,she adds liquid manure
around the plant.
Practices farmers have experimented with in their vegetable gardens:
-Liquid manure (made from Chicken and cow dung)
-Compost making
-Trench beds preparation
-Seedling production and transplantation
Baba Xaba, one of the learning group participants,shared he prefers to use fertilizers,because
fertilizer helps the crops to grow faster and grow bigger since he plants with the purpose of selling his
produce. He also experimented with trench bedsin his garden which improved soil fertility and
harvest. But, due to lack of access to water to irrigate and low rainfall in the community he did not
manage to continue planting vegetables. There was a project that was willing to assist them with the
construction of tunnels and irrigation systems but all that was not successful due to changing of
management in that programme but they still willing to start. The elderly farmers revealed that while
they love farming, especially vegetable gardening they don’t have enough energy to attend to farming
like they used to. But they are also still willing to do something that requires less labour, to which
Mazwi advised that tower gardens would be a suitable practice for them, as it is not labour intensive
and uses grey water for irrigation.
Introduction of practices
This segment of the workshop introduced practices the farmers could try out immediately or in the
near future to solve some of the current issues discussed and to discuss the current adaptation

WRC K4/2719 Deliverable 5: Interim report; Refined decision support system for smallholder CSA-October 2018
19
measures they are practicing to solve these challenges. Some of the participants who are participating
in the Conservation Agriculture programme were familiar with mulching, no-tilland intercropping
practices. So, before introducing CSA practices to the farmers it was important to explain that most of
the practices can be implemented using materialsat home and low external inputs such as,
construction of trench beds, ridges and furrows, no-till, mulching and tower gardens etc.
Above left & right: Mazwi Dlamini introducing and explaining the water, soil and crop management
CSA practices to participants.
The practicesare categorized in four different groups; water management, soil management, crop
management, livestock, and natural resources. The following practices were explained to participants:
Water management
➢Run-off and contours
➢Diversion ditches
➢Bucket Drip kits
➢Mulching
➢Rain water harvesting storage (including jojo tanks)
➢Tower garden
➢Tied ridges
Soil management
➢Ridges and farrows
➢Contours
➢Cut off drains/swales
Crop management
➢Trench beds
➢Mulching
➢CA (No-till)
➢Tunnels
➢Inter cropping & crop rotation
Way Forward
Criteria used to select practices

WRC K4/2719 Deliverable 5: Interim report; Refined decision support system for smallholder CSA-October 2018
20
Participants selected a list of criteria to assist them to evaluate and select the practices they would
like to adopt. These criteria are usedto guide participants on which practices will be best suited for
their locality and socio-economic conditions. There are ‘standard’ criteria used to select CSA practices
such as, water availability, soil fertility, cost and labour but participants also thought that fencing and
motivation are important criteria they consider when selecting practices:
a) Water availability: The water use requirement for each practice
b) Soil fertility: The contribution of each practice to soil fertility
c) Cost: The affordability of the tools required to construct structures and/or sustain practices
d) Fencing: This relates to whether the practice/structure is secure, does not need fencing to protect
it from livestock invasion.
e) Labour: Thisrelates to the labour intensity and time required to construct structures and sustain
practice(s).
f) Motivation:This relates to the willingness to commit time and energy to upkeep the practice
Practices to be introduced:
These criteria areused to complete a matrix table that would assist the participants to select
prioritizedpractices. In their respective groups,participants selected 5 possible CSA practices to be
introduced. The scale (0,1,2) is used to determine the most suitable practices decided by all
participants and to evaluate the different practices to be introduced.
Right and Far
right: Tema and
Zanani assisting
farmers with
completing the
matrix table
Group One:
Scale: 0-low/easy/cheap; 1-medium/average; 2-difficult/high/expensive
Table 6: Group 1 Matrix Table (Madzikane)
Adaptations
Labour
Cost
Soil fertility
Water avail
Fencing
Motivation
TOTAL
Tunnels
1
1
1
2
2
2
9
Tank
2
0
0
2
2
2
8
Tower Garden
2
2
2
1
1
2
10
Mulching
2
2
2
2
0
1
9
Drip kits
1
2
1
2
2
2
10
WRC K4/2719 Deliverable 5: Interim report; Refined decision support system for smallholder CSA-October 2018
21
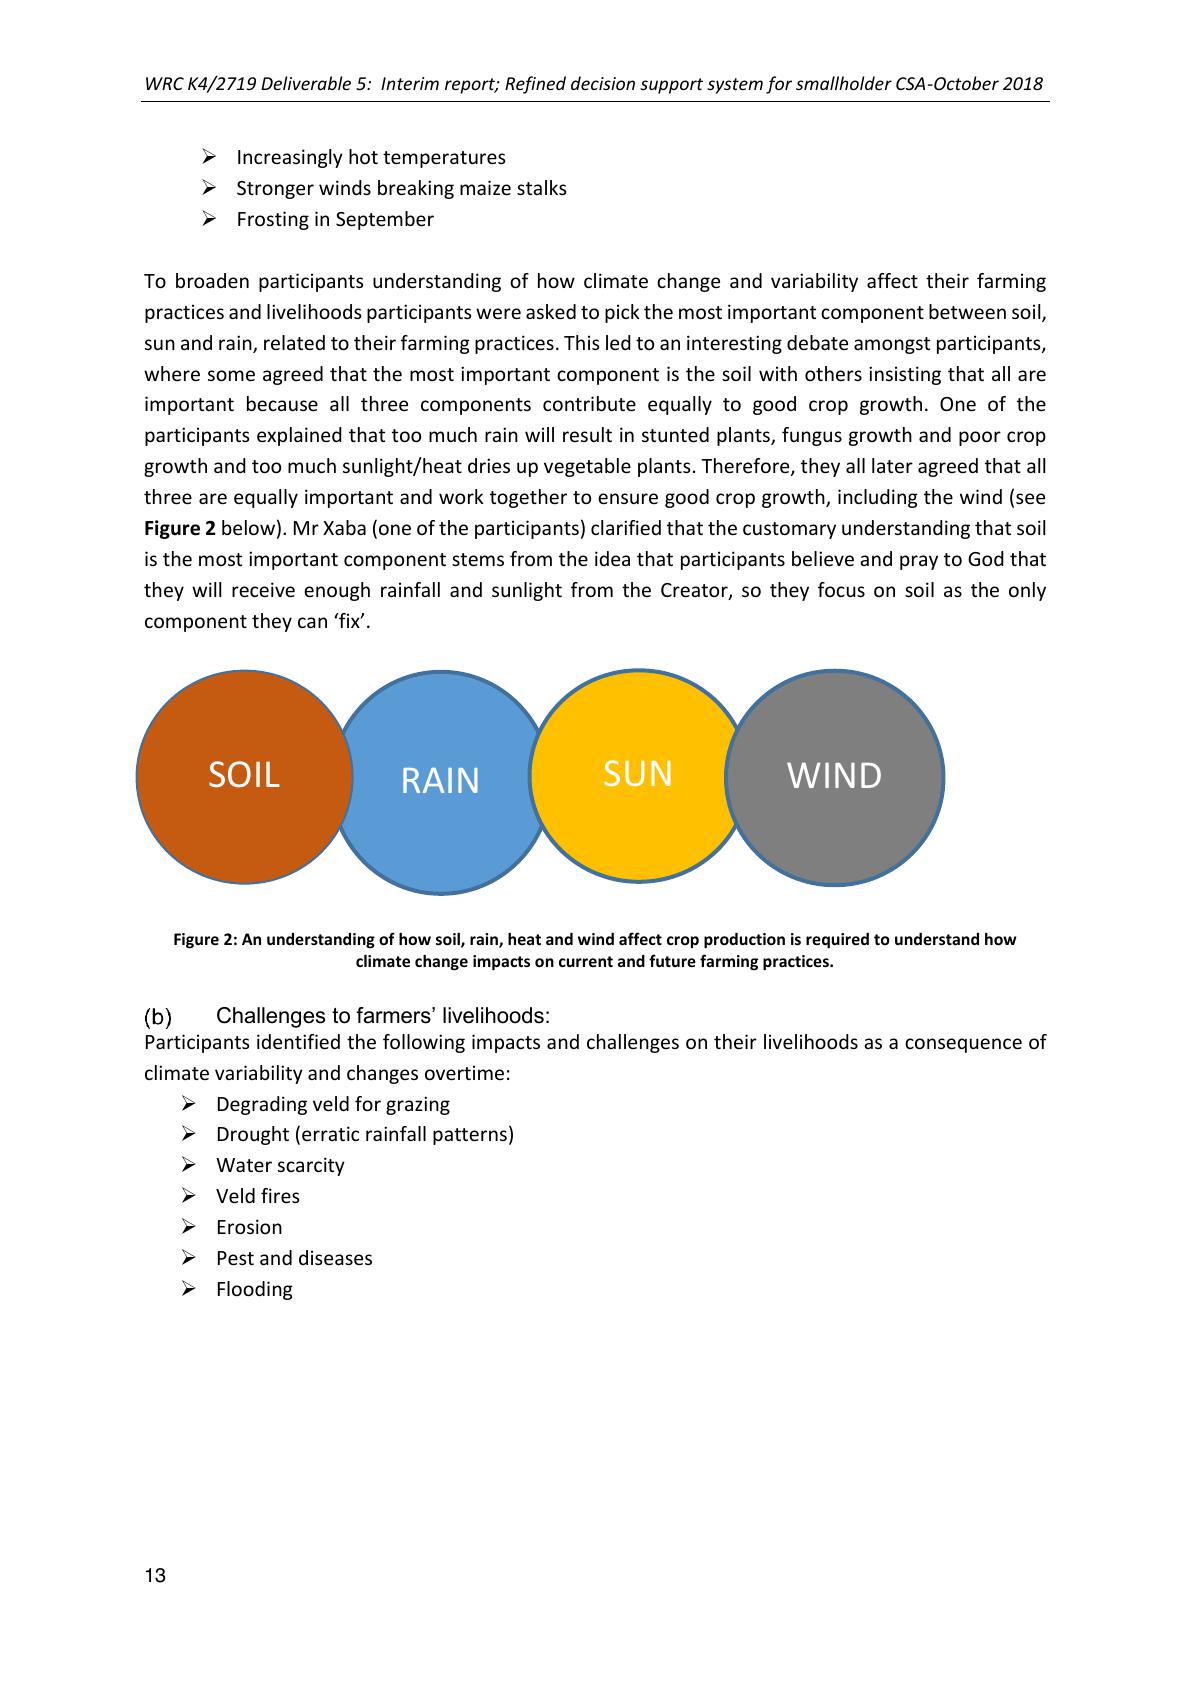
Group Two:
Scale: 0-low/easy/cheap; 1-medium/average; 2-difficult/high/expensive
Table 7: Group 2 Matrix Table (Madzikane)
Adaptations
Cost
Soil fertility
Water avail
Fencing
Motivation
Labour
TOTAL
Drip kits
1
1
2
0
2
1
7
Terraces
1
1
2
0
1
0
5
Ridges and
furrows
2
2
2
0
2
1
9
Tunnel
1
1
2
0
2
1
7
Tower
Garden
1
2
2
0
2
1
8
The next workshop was planned for January 2019, to finalise prioritization of practices and start on
the experimentation cycle.
CCA Workshop 2 and 3 –Swayimane_SKZN
Written by Temakholo Mathebula and Khethiwe Mthethwa
These workshops focused on planning andprioritization of practices and the first round of
experimentation and implementation of prioritized practices in Gobizembe (Swayimane).
Practices initially prioritized in the 1st workshop are listed below for continuity sake:
1. Mix cropping
2. Drip kits
3. CA
4. Trenches
5. Cover crops
6. Tower gardens
7. Tunnels
SWAYIMANE-GOBIZEMBE WRC WORKSHOP 2: PLANNING AND PRIORITIZATIONOF
PRACTICES AND WORKSHOP 3: EXPIRIMENTATION
Introduction
This report is based on the WRC workshop 2-Planning and prioritisation of practices which took place
on the 07th of November 2018 and workshop 3: Experimentation,which took place on the 15th of
November 2018 in Swayimane-Gobizembe. Workshop 2 focused onareview of the previous workshop
discussions, Climate Smart Agriculture as a concept, SCA practices andpractices that farmers selected
on the previous workshop, pest and disease control, practices video, five categories of practices, group
prioritization and the individual prioritisation. Workshop 3 was a practical demonstration workshop
to further introduce someof the practices chosen by farmers. The tower gardening and eco-circle
implementation process will be discussed and lastly a short section is included forthe progress of
tunnel trench bed preparation.
WRC K4/2719 Deliverable 5: Interim report; Refined decision support system for smallholder CSA-October 2018
22
SECTION 1: WORKSHOP 2: PLANNING AND PRIORITISATION OF PRACTICES
Review ofthe previous workshop discussions
In this session farmers briefly reviewed their understanding of climate change, including that farmers
seeingchanges in theclimate. It was said that these changes are due to harmful gases produced by
industries which affect the ozone layer.
The impact of climate change that has been noticed is that the soil is now much drier. Crops are not
growing so wellandyields have decreased. Previously people were harvesting and they could even
have a surplus to share with neighbours. There is a decrease in soil fertilityandincreased outbreaks
of pestssuch as mosquitos, aphids, snails, cutworms. Farmers were informed that ladybirds are insects
that cause no harm to the crops. Farmers have noticed that the change in climate leads to change in
planting dates.
Adaptive measures that farmers are consideringare raised beds, more reliance oncompost than
fertilisers, making of contoursandpest and disease control such as the use of ash. It was mentioned
that one of the challenges with usingash is that it is scarce because farmers do not use fires anymore.
Chillies mixed withparaffin is also use to control pests and diseases. Also,farmers plant onions in
between other crops to control pests and diseases.
Mama Xasibe shared that she mixes cow manure with soil, she opens tram lines, makes swales and
contours and she also plants marigold flowers around the beds to control pests.
Furthermore, farmers discussed that there is a need to look at how we can change the way people do
things. Farmers rely more on GMOfood. The passion for farming is decreasing and youth involvement
in agriculture is less.
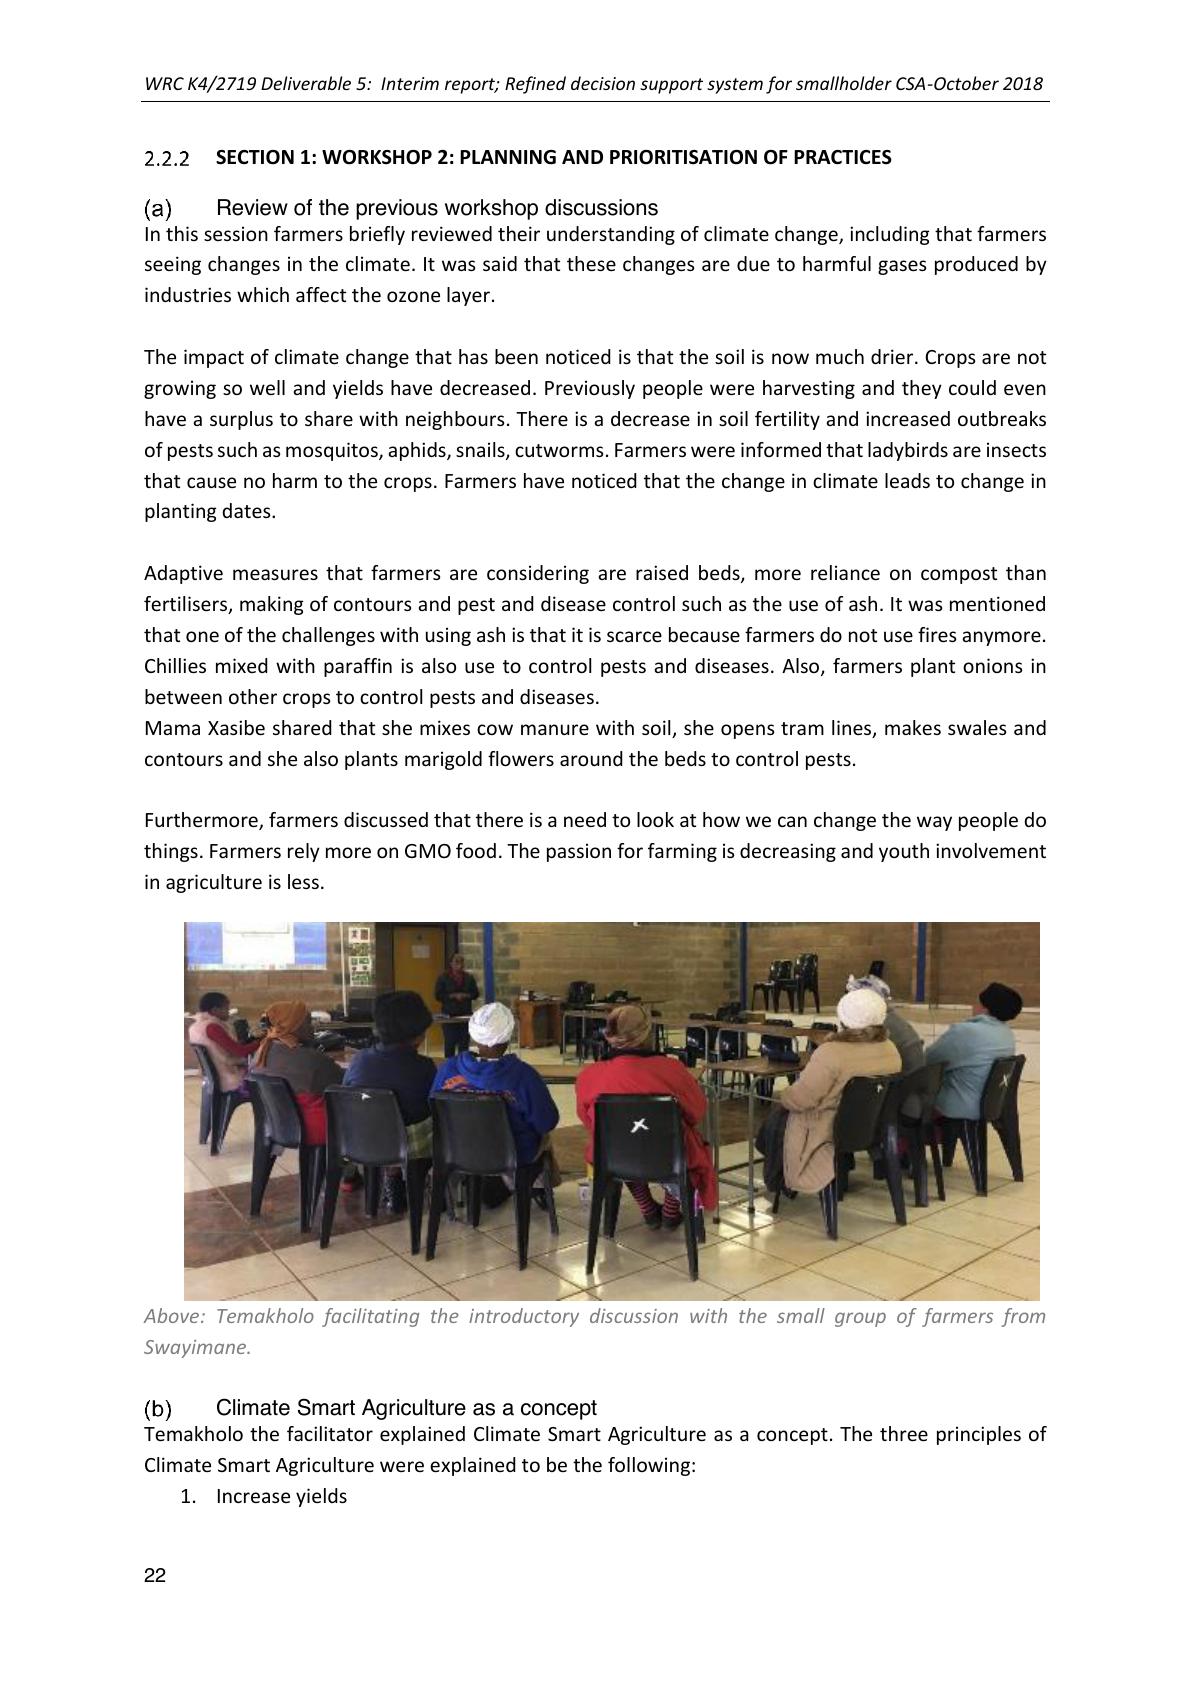
Above: Temakholo facilitating the introductory discussion with the small group of farmers from
Swayimane.
Climate Smart Agriculture as a concept
Temakholo the facilitator explained Climate Smart Agriculture as a concept. The three principles of
Climate Smart Agriculture were explained to be the following:
1. Increase yields

WRC K4/2719 Deliverable 5: Interim report; Refined decision support system for smallholder CSA-October 2018
23
2. Sustainability and Increased adaptation and resilience.
3. Decrease greenhouse gas emissions. (industrial effect, fertilisers, carbon monoxide from cars
etc)
It was further explained that we are trying to integrate different practices because we believe one
solution cannot solve everything.
CSA Practices
Practices that farmers selected on the previous workshop
Farmers mentioned that onthe previous meeting they said they would like to try out a tower gardens,
trench beds, tunnelsand drip kits. The new idea that came up on the day was planting on a cylindrical
fence, and about two farmers were interested to try it out. Farmers also asked how to plant or grow
cucumber it was then suggested that cucumber should be included on the seeds list to be purchased.
Pest and disease control
Pestsand diseases areone of the challenges farmers are facingand they would like to try more options
to control pests and diseases. A few methodsthat were suggested includedusing Amaranthus, (1 mug
Boxer(ugwayi)+ 4L water +plus grated green bar soup), Worm wood leaves(mix with waterand
sunlightsoap), liquid manure andplanting garlic chives (ishaladi lezinyoka).It was further explained
thatartificialchemicals are not the same as homemade remedies that are more environmentally
friendly –but may not be as fast acting.
Practices video
A composting and Manure Utilization to Promote Organic Growing: Natural Methods for Improving
Soil Health and Fertility training DVD (Produced by MDf and KZNDARD in 2011), was used to explain
practices instead of presenting the practices using a PowerPoint presentation. It was observed that
farmers learn better using graphics and visual aids. Farmers were able to recognise all the practices of
their interest after playing the video. The video is very clear, it is communicated in IsiZulu and it kept
the farmers well concentrated and well-motivated.
Five categories of practices
It was emphasised to farmers that the practices are categorised into five categories, and this is done
to allow farmers to try out a wide range of practices without being tempted to only focus on the
gardening practices. It was observed that farmers are not paying much attention in trying out livestock
practices. It is assumed that farmers have good vegetation, their livestock is not struggling with feed
that is why they were not mentioning livestock in their options. It is suggested that in the next season
we can see how livestock integration will be incorporated in this village.
Below is a small table outlining the practices prioritized by this farmer group
Table 8:CSA practices prioritized by the Swayimane farmers group, according to the 5 resource management categories
Practices
Water
Soil
Crops
livestock
Natural resources
1.Tower garden
✓
✓
✓
✓
2.Trench bed
✓
✓
✓
✓
3.New idea-Worm
farming
✓
✓
✓

WRC K4/2719 Deliverable 5: Interim report; Refined decision support system for smallholder CSA-October 2018
24
4.Drip kit
✓
✓
5.Pest anddisease
control
6. Manure
✓
✓
7.Mixed Cropping
✓
✓
✓
✓
Group Prioritization
Below is the final list of practices prioritized by the group
1. Tower Garden
2. Tunnel
3. Trenched bed/shallow trench
4. Drip bucket
5. Mixed Cropping
6. Manure
7. Pest and disease
8. Cylinder fence garden
9. Worm Farming
10. Mushroom production
11. Eco circle
Individual Prioritisation
75% of farmers want to try out the tower gardens and 86% wantto try the eco circle. The tunnel
appeared as a second priority in the group prioritisation. Regarding the tunnel, it was emphasised to
farmers that for a tunnel to be installed three trenches must be dug and at least one trench outside
the tunnel for making comparisons and that only one tunnel could be installed as an initial
demonstration. Farmers requested that the bucket drip kits go to those where the tunnel hasnot been
installed and this was agreed to.
All farmers were happy about the tunnel being installed in Mama Ngobese’s garden and also farmers
availed themselves to assist her with digging the trenches. Mama Lindiwe Zondi volunteered to do
trench bedswith no expectation of getting a tunnel and she also wants to try the shallow trench beds
(30 cm). All the participants with a trench bed will have a bucket-drip. The mixed cropping, manure
and disease control will be standard for all the participants-All participants will try out these practices.
The cylindrical fenced garden, worm farming and mushroomswere other new proposed practices. The
table below shows the list of practices chosen and the names of the participants.
Table 9: Individual practices as chosen by Swayimane farmer
Lindiwe
Zondi
Thandazile
Mathonsi
Constance
Mcanyana
Mthephi
Chonco
Ritha
Ngobese
Khanyisile
Xasibe
Busisiwe
Khoza
1.Tower Garden
✓
✓
✓
✓
2.Tunnel
✓
3.Trenched
✓
✓
4. shallow trench
✓
5.Drip bucket
✓
✓
6. Mixed Cropping
✓
✓
✓
✓
✓
✓
✓

WRC K4/2719 Deliverable 5: Interim report; Refined decision support system for smallholder CSA-October 2018
25
7. Manure
✓
✓
✓
✓
✓
✓
✓
8. Pest and disease
✓
✓
✓
✓
✓
✓
✓
9. Eco circle
✓
✓
✓
✓
✓
✓
Other proposed practices
10. Cylinder fence
garden
✓
✓
11. Worm Farming
✓
12. Mushroom
production
✓
Total
7
6
6
3
8
5
6
Plan for Experimentation (workshop 3)
The planning for the next workshop went well. The next workshop date was set to be on the 15th of
November 2018. A tower garden and an eco-circle were the two practices that were identified to be
carried out on the day of the experimentation. Mama Xasibe volunteered that by the 15th of November
she will have all the material required in her homestead. Mama Rita Ngobese who volunteered to do
the tunnel as well as other members in the learning group who committed to help her dig out trench
beds for the tunnel said it will be too much labour required for them to prepare 4 trench beds ready
by the 15th of November, however the farmers promised to start the digging of the trench as from the
8th of November (the next day).
SECTION 2: WORKSHOP 3: EXPERIMENTATION
This section contains the discussion about the demonstration of the tower gardenand eco-circle which
took place on Thursday the 15th of November 2018 at Mama Xasibe homestead garden as agreed on
the previous workshop. All the farmers were ready at the venue of the demonstration at 09HOOam.
Tower Garden and Eco-cycle
The farmer had a well fenced vegetable garden. She is using a hose pipe towater her garden. There
was plenty of water available during the demonstration. The materials for experimentation were
accessible also. The tower garden and the Eco circle were made 1.2 m away from each other.
Tower Garden
A diameter of one meter was measured between the poles of a tower garden. A sewed 3m by 1.5m
shade net was fitted onto the poles very gently. A mixture of soil, manure and ash (growing medium)
was used to fill the tower. A cylinder (made form a bottomless bucket) was used to fill upthe gravel
stones at the centre of thegrowing medium. Spinachwas planted along the outside of the tower using
a spacing of 15cm between crops. Additionally, 20cm spacingwas used to plant Chinesecabbage.
During the planning and the prioritisation meeting only four farmers were interested to carry out the
tower garden, after the experimentation workshop almost all the farmers wanted to try out the tower
garden.

WRC K4/2719 Deliverable 5: Interim report; Refined decision support system for smallholder CSA-October 2018
26
Above Left to Right; Completed demonstrationsof a tower garden and eco-circle. Filling the tower
garden with the central column of stones and putting up the poles and shade-cloth tower.
Eco-circle
This is a small raised circular garden. A circle was marked on the ground by attachinga 50cm long
string to draw a circular line on the ground. 30cm of top soil was removed separately and another 30
cm of sub soil was also put aside, this made up a total of 60cm deep trench which is likely to be a knee
height. An empty 2L bottle was used to distribute water evenly by burningit with an electric driller to
open holes, alternatively a wire/nail can be heat up to burn holes. The bottle is placed in the centre
of the circle while the pit is being filled. It is filled with layers of sub soil, organic matter, cow manure,
dry grassand top soil. Seedlings were then planted and thegardenwas mulched to retain soil
moisture. The garden was made to be basin so that it can also collect and retain water from the rain.
Lastly, stones were loosely packed aroundthe garden tocontrol soil erosion and for decoration
purposes.
Right and Far-
right: Digging out
the eco-circle bed
and the final bed
with seedlings
planted, mulching
and the 2litre
watering bottle in
the centre
Farmer led experimentation
A discussion was then held on farmer led experimentationwhere the objectives of project were
explained. The main points emphasized were that research is a process of inquiry and often begins
with a question or a problem that requires a solution. In the context of climate change, the objective
is to come up with a decision support system that allows the farmer to explore a basket of practices
based on certain criteria.

WRC K4/2719 Deliverable 5: Interim report; Refined decision support system for smallholder CSA-October 2018
27
Practices were divided into five categories namely water, soil, crop, livestock and natural resources
and criteria were developed to measure which of these categories do the practices fit into the most.
Climate smart agriculture is about increased productivity, adaptation and mitigation. In light of those
three, what changes have the farmers observed due to climate change? How can these be addressed?
What informs those decisions?
The facilitator explained that whenever a new practice is introduced it mustbe measured against what
is already being done in order to assess whether it brings about any change or not. An example was
made comparing the tower garden to normal planting practices, whereby the farmer planted spinach
on both at similar times. The farmer would therefore need to look at and record how often she
irrigates on both, how muchshe irrigates, crop colour, quality and final yield. Another example that
was made was about comparing shallow trenches and deep trenches against normal planting (on
level/ flat ground) practice in terms of effect on crop growth, quality and final yield. Consistency is
important when taking records as it allows us to not only keep track of the progress but to also identify
trends. The agreement was that a monitoring template will be used for recording purposes.
CCA workshop 4 and 5
Ntabamhlophe (Estcourt-KZN)
Written by SamukelisiweMkhize and Khethiwe Mthethwa
Introduction
On the 14th November three homesteadswere visitedto assess the experimentation of CSAgarden
practices implemented in twovillages; De Klerk and Enkunzini.The purpose of the visit was to track
progress of the practices being implemented, use of the five finger management practices, recording
their experiences, and understanding including challenges and successes during the experimentation
process in order to use the information to improve the process and ensure successful implementation
of practices. The participants are part of the WRC Climate-smart agriculture programme in
collaboration with LIMA-RDF and Mahlathini Development foundation.
De Klerk(Learning site and participants case studies)
Mama Claudia Ntuli
Mama Nto Ntuliis a 56 year old, unemployed woman and household head with a family of 2 children.
She is a member of the De Klerk learning group, her home garden is used by 8 female participants in
the learning group as a collective learning site. The women work and learn together how to construct
and manage the tunnel and tower gardens. Some of the women have tried to model the construction
of the practicesand structures implemented in thelearning group, namely Sthembile Hadebe and
Tholani Xulu used as case studies in this report. The women share the responsibility of monitoring
plant growth, weeding and general maintenance of the practices including joint purchase of seedlings
and other inputs required.
So far, they have contributed R20 each twice to buy 40 heads of cabbage, spinach, onions, green
pepper and beetroot seedlingsplanted in the tunnel. 40Harvested cabbages at R10 each were sold
locally to neighbours, the money was used to buy more seedlings planted in the trench beds. Most of

WRC K4/2719 Deliverable 5: Interim report; Refined decision support system for smallholder CSA-October 2018
28
the other vegetable crops planted in the tunnel did not survive the very cold winter months, plants
were frost bitten.
Above left: Tunnel (collective learning site) Above right: Tower garden in Mama Ntuli’s
home
The drippers attached to the drip system were 30 cm apartinsteadof 15 cm (recommended distance),
which caused the drippers not to irrigate directly into the crops. Also, the drip pipes were located on
the perimeter of the trench bed instead of being placed in between the crops. This led the farmers to
believe that the system wasineffective and crops were not receiving enough water. They are now
using 20l watering cans to irrigate the trench beds twice daily, working against the purpose of saving
water by using less water.The farmers were asked to correct the spacing15cm instead of the 20l
watering cans and to check the distribution ofthe water below the surface of the soil, before deciding
to abandon the practice.
Above left: Dry drip bucket (not being used) Above right: Keyhole garden constructed by the
participants
Sthembile Hadebe
Right and far right:
Mama Sthembile
Hadebe and her fenced
vegetable garden

WRC K4/2719 Deliverable 5: Interim report; Refined decision support system for smallholder CSA-October 2018
29
She is one of the farmers in the De Klerk community learning group. Her 10m*8m garden is still under
construction, she has started fencing the garden to prevent livestock from feeding on her crops. She
has also started implementingpractices learnt with the learning group, two trench beds,mixed
cropping cabbages and brinjal with mulch on one bed and mono-cropped carrots with mulch on the
second bed. Mama Hadebe stated she is very happy with the practices, the intercropping on the first
bed has helped to controlthe pest and diseases affecting growing crops. While, the mulch in the
second bed has vastly increased the carrot yields harvested.Before experimenting with the trench
beds and mulching the carrots were stunted, fewer and smaller in size. She testified that, ‘I have never
harvested so many carrots before’. A thirdbed is still under construction, after seeing the growth
potential of her vegetables and greater yields grown in the other two trenches she has decided to dig
a 60cm deep hole where she plans on planting more vegetables. Each trench bed is irrigatedonce a
day using 20lbucket of water, shehas observedthat sometimes the 20l isnot enough because of high
temperaturein the summer months, low rainfall in the winter monthsthe soil gets dry. She has a
community tap that is close to her homestead but water does not always comeoutso she does not
get enough water to irrigate sufficiently.
Right: Trench beds)
intercropped and Far right:
Marigold seedling production
She tried to construct a tower
garden but it collapsed
because the poles used were
too thin to hold up the
structure. She had no-one to help her to gather poles big enough to hold the structure together and
the sackswere too big, but she still plans on trying to build a new tower garden with help. She believes
that with her childrens’ helpand the proper materials (measurement of poles & sacks) she can rebuild
it because she received good training during the workshops and learnt with the learning how to build
one properly.
Tholani Xulu
Right: Mama
Tholani Xuluin
her garden
Far right:
intercrop of
onions and
spinach

WRC K4/2719 Deliverable 5: Interim report; Refined decision support system for smallholder CSA-October 2018
30
She is 67 years old, unemployed and living with four grandchildren of whom one receives child grant.
She is anactive member of theDe Klerk community learning group. Besides the social grant payments
(child and old age grant), she relies on her farming activities to provide for food for her family; 15
indigenous chickens, 2 goats, peach trees, a 7m*5m garden size where she mixes cropssuchas onions,
spinach, potatoes, parsley and tomatoes.So far, she is onlyexperimenting with trench beds, after
witnessing the vigorous growth of the cabbages planted in the tunnel (collective learning site). Her
vegetables are growingwell on the beds, herbiggest problem is cutworms. She has tried to use salt to
reduce the number of cutworms and number of the pests in the garden.
She wants to start experimentingwith keyhole gardening because she has limited space and to see
how it will improve her crop growth in the dry and hot months. Time and materials are the factors
that hinder the famer from implementing all the practice shehas learnt. She explained that while she
wants to start keyhole gardening,she has to travel far tocarry large river stones. Also,livestock
trampling is a problem. People in the community do not manage their livestock, cows and goats enter
into her field and garden when she is not around. During the trainings she also learnt about mulching
andcompostmaking andshe has started sharing the knowledge with other farmersin the community.
She also shares her harvest with her neighbours,recently she harvested 10 cabbages, and shared some
of the harvest (2 cabbages) with her neighbour and the restwereeaten with her four grandchildren.
She eats one cabbage per week withfamily. She cooks it once a week as a stew and make salads
occasionally with any left overs. The farmer watersher garden oncea day because, her water tap does
not provide water throughout the day.
Above left:Ma Xulu’s garden crops and each tree. Above right:yellowcolour on carrot leaves (nutrient
deficient-not planted on trench bed).
Enkunzini
Zanele Ngobese
Right: Mama Zanele
Ngobese
Far right:
Intercropped
Lettuce and
cabbages
WRC K4/2719 Deliverable 5: Interim report; Refined decision support system for smallholder CSA-October 2018
31
She is a 48 years old housewife and passionate farmer living with her husband and three children. Her
husband, a police officer, is very supportiveof her farming activities. He assistsher with purchasing
almost all the materials and inputsshe needs for her garden. The dedicated farmer attended CSA
workshops, she gained knowledge and skills and she was able to implement the knowledge she has
obtained to construct hertrench bedsand she switched from mono cropping to intercroppingon all
her beds.
She isalso one of the farmers who has a tunnel experiment in her garden used as a learning site for
other participants in the Enkunzini community. But she has the sole responsibility of maintaining the
structure, monitoring plant growth, practices and watering with a bucket drip.She frequently thins
her vegetable leaves and uses the residue as compost. She has not been using the drip system to
irrigate her plants, she explained that the buckets often topple over due to heavy winds and do not
water the crops sufficiently. Instead she uses a hose pipe to water her plants daily. This seems to be a
misguided belief amongst participants that drip kits do not provide plants with enough water, which
leads them to opt to over watering their beds with hose pipes and buckets. The soil was slippery and
very wet, indicating that too much water was being used on a daily basis instead of saving water
through the use of drip irrigation. She was advised to secure the buckets with stones, start using the
bucket system and observe the growth of her crops.
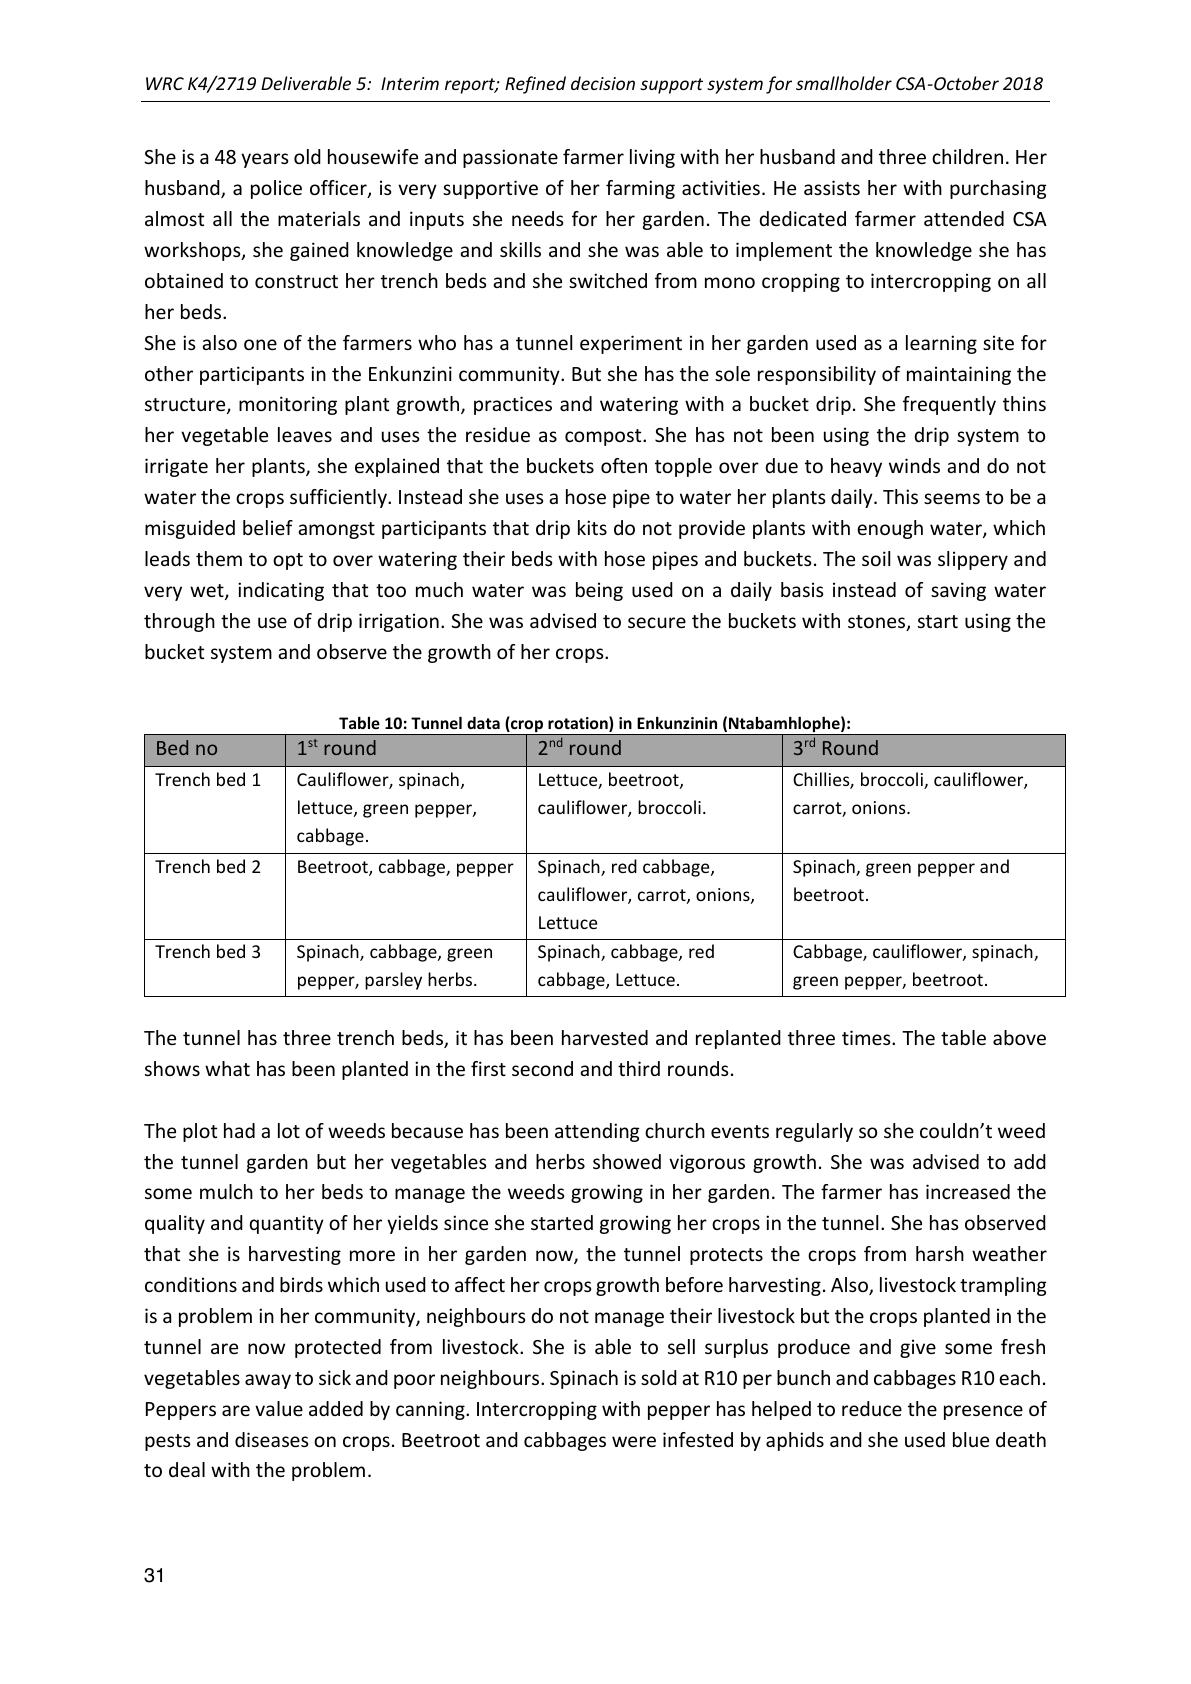
Table 10: Tunnel data (crop rotation) in Enkunzinin (Ntabamhlophe):
Bed no
1st round
2nd round
3rd Round
Trench bed 1
Cauliflower, spinach,
lettuce, green pepper,
cabbage.
Lettuce, beetroot,
cauliflower, broccoli.
Chillies, broccoli, cauliflower,
carrot, onions.
Trench bed 2
Beetroot, cabbage, pepper
Spinach, red cabbage,
cauliflower, carrot, onions,
Lettuce
Spinach, green pepper and
beetroot.
Trench bed 3
Spinach, cabbage, green
pepper, parsley herbs.
Spinach, cabbage, red
cabbage, Lettuce.
Cabbage, cauliflower, spinach,
green pepper, beetroot.
The tunnel has three trench beds, it has been harvested and replanted three times.The table above
shows what has been planted in the first second and third rounds.
The plot had a lot of weeds because has been attending church events regularly so she couldn’t weed
the tunnel garden but her vegetables and herbs showed vigorous growth.She was advised to add
some mulch to her beds to manage the weeds growing in her garden. The farmer has increased the
quality and quantity of her yields since she started growing her crops in the tunnel. She has observed
that she is harvesting more in her garden now, the tunnel protects the crops from harsh weather
conditions and birds which used to affect her crops growth before harvesting. Also, livestock trampling
is a problem in her community, neighbours do not manage their livestock but the crops planted in the
tunnel are nowprotected from livestock. She is able to sell surplus produce and give somefresh
vegetables away to sick and poor neighbours. Spinach is sold at R10 per bunch and cabbages R10 each.
Peppers are value added by canning. Intercropping with pepper has helped to reduce the presence of
pests and diseases on crops. Beetroot and cabbages were infested by aphids andshe used blue death
to deal with the problem.
WRC K4/2719 Deliverable 5: Interim report; Refined decision support system for smallholder CSA-October 2018
32
She has another 8m by 8m organic garden covered with a black shade net. The shaded garden has
four small beds with mixed cropsof onions, cabbage, green pepper, beetroot, spinach, and pepper.
She usesa25L bucket for irrigating in the morning and in the afternoon. Temperatures are very high
during the day, plants are wilting if not thoroughly irrigated. She also hasan 8m*8m tilledfieldplot
where she wants to plant spinach.Last year she planted potatoes, beans and maize (crop rotating).
She hasexpressed an interest in Conservation Agriculture(no-till)farming because she wants to
reduce erosion in her field.A one meterdiameter area has been demarcated for the Eco circle to be
constructed.
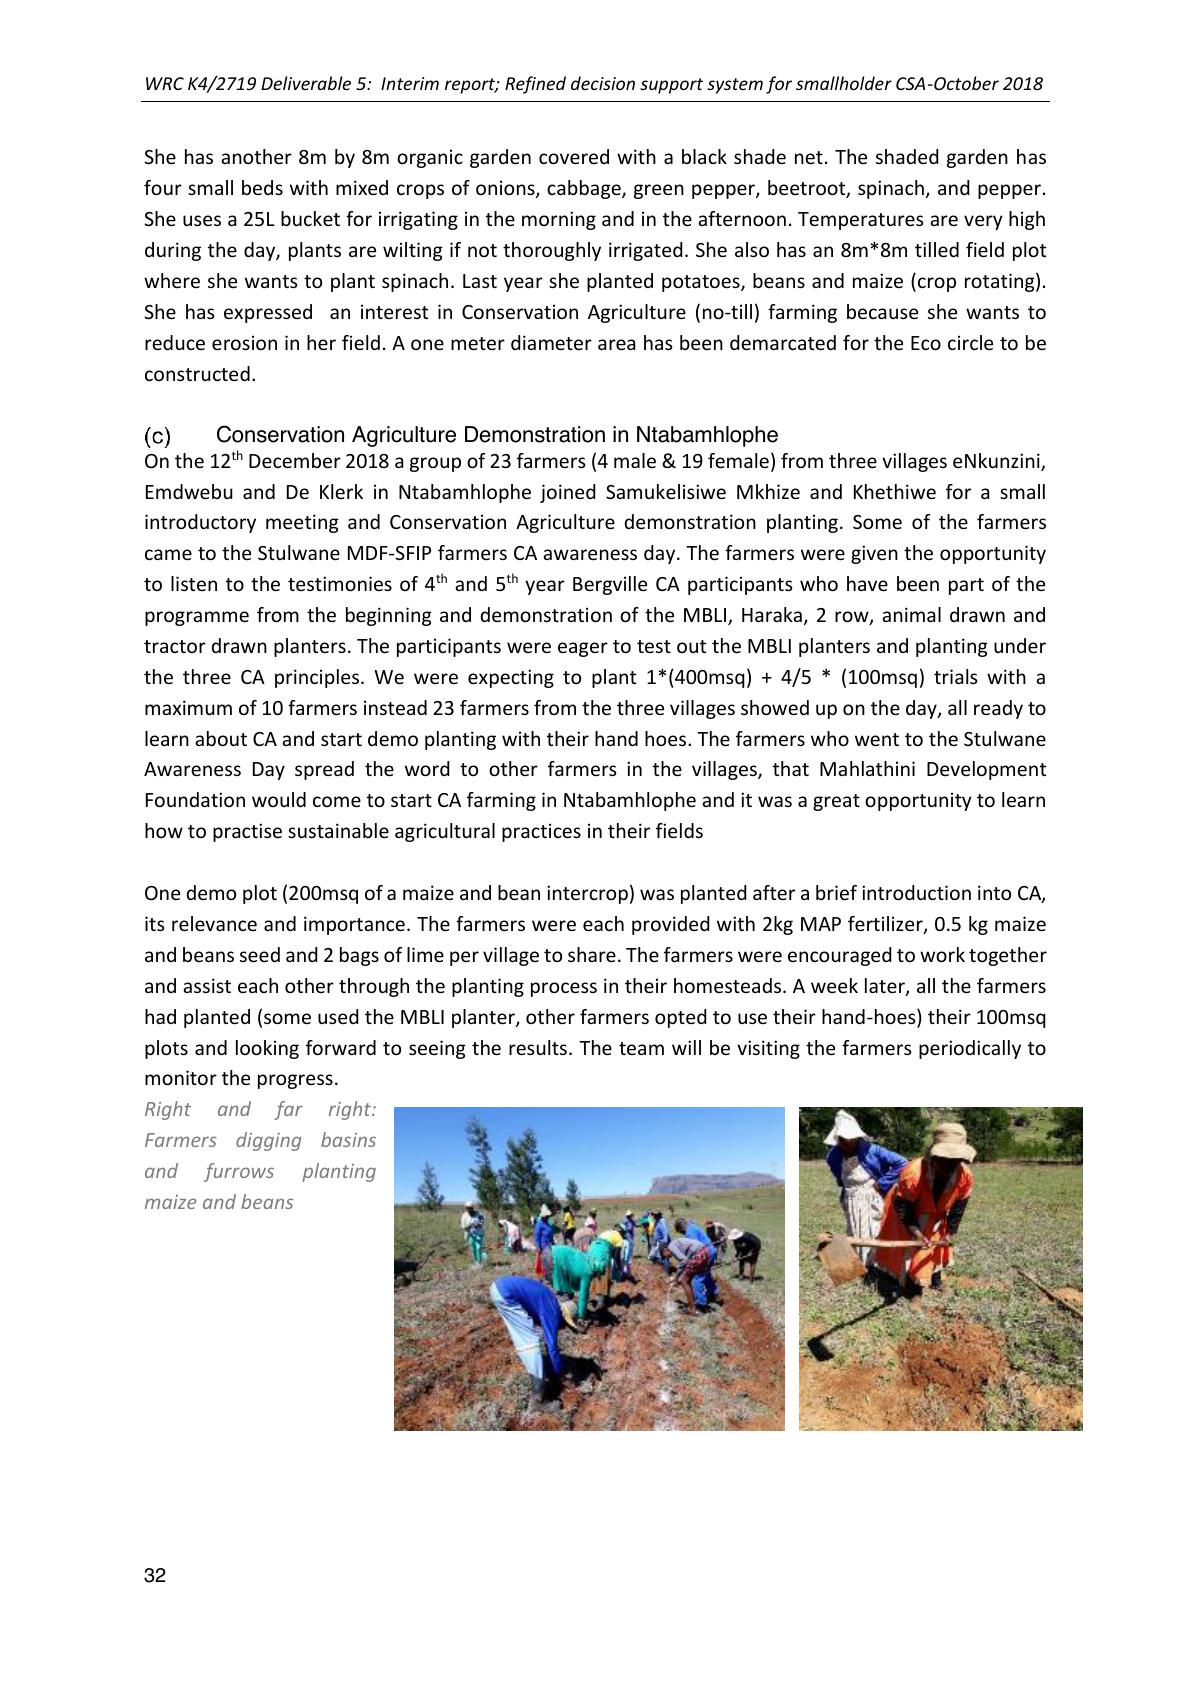
Conservation Agriculture Demonstration in Ntabamhlophe
On the 12th December 2018 a group of 23 farmers (4 male & 19 female) from three villages eNkunzini,
Emdwebu and De Klerk in Ntabamhlophe joined Samukelisiwe Mkhize and Khethiwe for a small
introductory meeting and Conservation Agriculture demonstration planting. Someof the farmers
came to the Stulwane MDF-SFIP farmers CA awareness day. The farmers were given the opportunity
to listen to the testimonies of 4th and 5th year Bergville CA participants who have been part of the
programme from the beginningand demonstration of the MBLI, Haraka, 2 row, animal drawn and
tractor drawn planters. The participants were eager to test out the MBLI planters and planting under
the three CA principles. We were expecting to plant 1*(400msq) + 4/5 * (100msq) trials with a
maximum of 10 farmers instead 23 farmers from the three villages showed up on the day, all ready to
learn about CA and start demo planting with their hand hoes. The farmers who went to the Stulwane
Awareness Day spread the word to other farmers in the villages, that Mahlathini Development
Foundation would come to start CA farming in Ntabamhlophe and it was a great opportunity to learn
how to practise sustainable agricultural practices in their fields
One demo plot (200msqof a maize and bean intercrop) was planted after a briefintroduction into CA,
its relevance and importance. The farmers were eachprovided with2kg MAP fertilizer, 0.5 kg maize
and beans seed and 2 bags of lime per village to share. The farmers were encouraged to work together
and assist each other through the planting process in their homesteads. A week later, all the farmers
had planted (some used the MBLI planter, other farmers opted to use their hand-hoes) their 100msq
plots and looking forward to seeing the results. The team will be visiting the farmers periodically to
monitor the progress.
Right and far right:
Farmers digging basins
and furrowsplanting
maize and beans
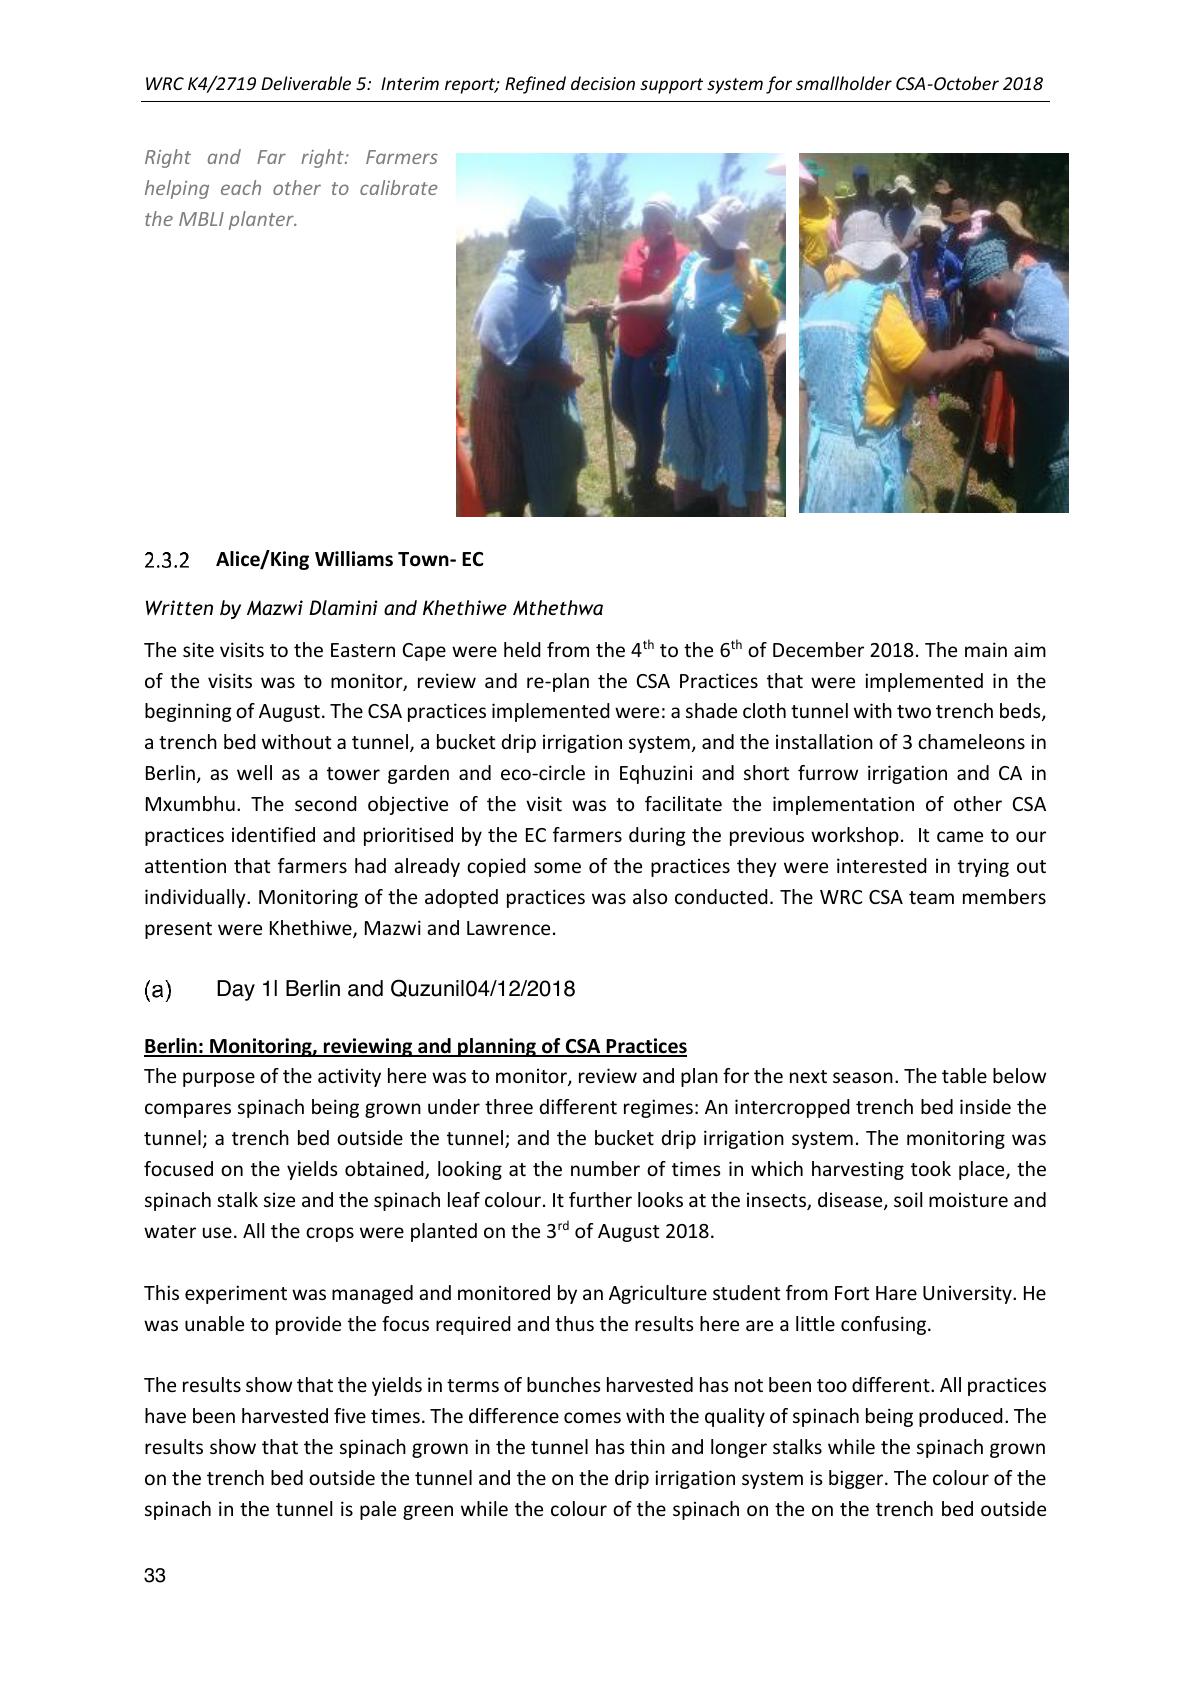
WRC K4/2719 Deliverable 5: Interim report; Refined decision support system for smallholder CSA-October 2018
33
Right and Far right: Farmers
helping each other to calibrate
the MBLI planter.
Alice/King Williams Town- EC
Written by Mazwi Dlamini and Khethiwe Mthethwa
The site visits to the Eastern Cape were held from the 4th to the 6th of December 2018. The main aim
of the visits wasto monitor, review and re-plan the CSA Practices that were implemented in the
beginning of August. The CSA practices implemented were: a shade cloth tunnel with two trench beds,
a trench bed without a tunnel, a bucket drip irrigation system, and the installation of 3 chameleons in
Berlin, as well as a tower gardenand eco-circlein Eqhuziniand short furrow irrigation and CA in
Mxumbhu.The second objective of the visit was to facilitate the implementation of other CSA
practices identified and prioritisedby the EC farmers during the previous workshop. It came to our
attention that farmers had already copied some of the practices they were interested in trying out
individually. Monitoring of the adopted practices was also conducted. The WRC CSA team members
present were Khethiwe, Mazwi and Lawrence.
Day 1| Berlin and Quzuni|04/12/2018
Berlin: Monitoring, reviewing and planning of CSA Practices
The purpose of the activity here was to monitor, review and plan for the next season. The table below
compares spinach being grown under three different regimes: An intercropped trench bed inside the
tunnel; a trenchbed outside the tunnel; and the bucket drip irrigation system. The monitoring was
focused on the yields obtained, looking at the number of times in which harvesting took place, the
spinach stalk size and thespinachleaf colour. It further looks at the insects, disease, soil moisture and
water use. All the crops were planted on the 3rd of August 2018.
This experimentwas managed and monitored by anAgriculture student from Fort Hare University. He
was unable to provide the focus required and thus the results here are a little confusing.
The results showthat the yields in terms of bunches harvested has not been too different. All practices
have been harvested five times. The difference comes with the quality of spinach being produced. The
results show that the spinach grown in the tunnel has thin and longer stalks while the spinach grown
on the trench bed outside the tunnel and the on the drip irrigation system is bigger. The colour of the
spinach in the tunnel is pale green while the colour of the spinach on the on the trenchbed outside

WRC K4/2719 Deliverable 5: Interim report; Refined decision support system for smallholder CSA-October 2018
34
the tunnel and the on the drip irrigation system is darker green in colour. The pale green symbolises
lack of chlorophyll due to reduced fertility and or sunlight. In the tunnel there has apparently been
fewer pest and disease problems, which may be due to the shade cloth preventinginsects from
reaching the plants, and perhaps also due to some extent to the intercropping that was only done in
the tunnel. The farmersobservedthat intercropping has a very positive impact in reducing the amount
of pests and diseases. Regarding soil moisture: there is more retention of soil moisture in the tunnel
because the net providesshade. There is less soil moisture retained in the trenchbed outside the
tunnel indicated bythe spinach leaves wiltingduring high temperatures. There is more soil moisture
retained on the bed where there is a bucket drip since the drops are constantly supplied to the soil.
In terms of water use, it hasbeen very inconsistentfor all the practices, a hosepipe is used for irrigation
therefore it is not easy to determine the amount of water used. Irrigation takes place roughly three
times a week. Farmers wereencouraged to make use of awatering can with a known volume in order
to keep track of the amount of water use.The Drip kit was recognised to have less labour as far as
irrigation is concerned, while watering using cans takes a lot of time and energy.
Table 11:Compare experiment in the tunnel, outside the tunnel and bucket drip system
Practice
Crops
grown
Harvest
times
Stalk
size
Leaf
colour
Insects
Diseases
Soil moisture
Tunnel,
Trench
bed
(5mx1m
and
2mx1m)
Spinach,
onions,
tomatoes
*Harvested
five times
spinach
stalks
are thin
and
longer
Pale
green
Fewer
Fewer
The net provides
shade therefore
soil moisture is
retained
Trench
bed
outside
the tunnel
Spinach
only
*Harvested
five times
Spinach
stalks
are
bigger
Darker
green
More
More
Spinach wilts
during high
temperature,
therefore less
moisture retained
Bucket
Drip
(trench
bed
outside
the
tunnel)
Spinach
only
*Harvested
five times
Spinach
stalks
are
bigger.
Darker
green
More
More
Water moisture is
retained for a
longer time since
the drip is
constantly
supplying water

WRC K4/2719 Deliverable 5: Interim report; Refined decision support system for smallholder CSA-October 2018
35
Chameleons
There is a chameleon installed for each of the practiceslisted above. The data has been collected by
Siyabonga Hafe, and intern at the Zingisa project in Berlin, from the University of Fort Hare. He
explained how the chameleon operates. The chameleon is a tool used by farmers to help them make
decisions on when to water, and the amount of water to be used for irrigation. The tool has a sensor
which demonstratesthree colours; green means there is still water in the soil, blue means there is
water but the farmer should irrigate and red means the soil is too dry. The data presented by the
sensors is automatically uploaded onto the Virtual Irrigation Academy (VIA) chameleon website. There
has been a challenge with getting the data uploaded online, and this was apparently due to the type
of cell phone Siya was using for monitoring the chameleons. At the day of the visit a different phone
was being used and the data was uploaded on the system immediately. One of the farmers asked
“…how can chameleons be applied in a big piece of land?” The response was that these practices are
intended to provide options for farmers to make decisions regarding their crops, with different options
being appropriate for different scales of farming. However, the chameleon can be used at larger
scales, but more of them will be required. Some handouts on mixed cropping were left with the
farmers, and the lead trainer with the Zingisa project was provided with an electronic version of the
CSA practices document.
Website
name: https://via.farm/myfarms/
User name: sselala
Password: dgen3090
Sensor:
User name starts withAndriod1<= >
87654321,password123445678
When the readeris tryingto change
the user name to Andriod1
Figure 4:Siya explains the use of the chameleon to the farmers
Figure 3: Shows spinach grown inside the tunnel and the spinach grown under drip irrigation system

WRC K4/2719 Deliverable 5: Interim report; Refined decision support system for smallholder CSA-October 2018
36
Below are the Chameleon print outs for the entire season for the three beds
Figure 5: Chameleon readings for the trench bed inside the tunnel
From the above diagram, it is clear that the trench bed inside the tunnel was extremely dry for almost
the entire season. Watering only provided some moisture in the shallower depths of the soil. As a
consequence, the stress experienced by the crops planted is understandable- as is the reduced yield.
Figure 6:Chameleon readings for the trench bed outside the tunnel
For this trench bed the lack of water in the soil is even more obvious and underwatering was done
throughout the season.
Figure 7: Chameleon readings for the trench bed with the bucket drip irrigation system

WRC K4/2719 Deliverable 5: Interim report; Refined decision support system for smallholder CSA-October 2018
37
For this trench bed, the presence of the bucket drip system provided a means of ensuring regular and
sufficient watering of the bed, although the complete lack of watering between September and
November is still visible. The grey areas indicate extremely high water tension and thus very dry soil.
Suggestions and recommendations
MDF is to organise a Samsung phone that will be specifically used for the chameleons. This will play a
huge role in preventing thechallenges with hot spot settings that were experienced this season and
will allow for bettermanagement of the mobile data. The tool was regardedas being very effective
provided there is technical support to the user.
It was also decided that the manager of the centre, Eddie would take over the management of the
experiment and the reading of the chameleons.
eQuzini- Eco-circle
This activity was carried out in the homestead garden
of Mrs Phindiwe Msesiwe, who is a champion farmer
in her village, who has already progressed well in
developing a varied demonstration garden, including
trench beds and a tower garden, constructed during
the previous workshop with the CSA team. She has
also constructed a small pond, fed by a diversion
furrow. During this visit she was sharing information
with her neighbours on all the various practices she is
experimenting with, particularly the tower garden.
Right: Phindiwe explaining the tower garden to her
neighbours
The focus of this visit was the construction of an eco-circle (or fertility pit, banana pit, infiltration pit,
circular swale). This is a small raised circular garden. A circle was marked on the ground by attaching
a 50cm long string to draw a circular line on the ground. 30cm of top soil was removed separately,
the soil was too shallow and dry that it couldn’t be dug any deeper than 40cm instead of 60cm. An
empty 2L bottle was heated up to burn holes to distribute water evenly in the ground. The bottle was
placed in the centre of the circle on the bottom of the pit. The pit was then refilled with layers of
Above left and right: Shows a complete eco-circle as well as the eQuzini farmers

WRC K4/2719 Deliverable 5: Interim report; Refined decision support system for smallholder CSA-October 2018
38
subsoil, organic matter, cow manure, dry grass and topsoil. Seedlings were then planted and the
garden was mulched to retain soil moisture. The garden was made to be basin like so that it can also
collect and retain water from the rain. The stones and excesse soil were loosely packed around the
garden to control soil erosionsince the site was on a gentle slope and also a small diversion furrow
was designed and made to channel rain water runoff to the eco-cycle. Handouts on fertility pits and
diversion furrows were left with the farmers. Mrs Msesiwe was asked to take photos of the pit every
2 weeks and send them via WhatsApp to the CSA team.
Day 2|Umxumbu|05/12/2018
(i)Mxumbu: Monitoring of CSA Practices and CA demonstration
The plan of the day was to conduct a CA demonstration in Mxumbu location with the Mxumbu Youth
Group farmers.It was a great to hear from the farmers that they have implemented some of the
practices that were discussed and demonstrated during the previous workshop. It is motivating to see
that farmers are putting the knowledge they have gained into practice. Furthermore, the farmers
explained that they had travelled to neighbouring communities to conduct workshops on some
practices such as CA and tower gardensand also trained farmers from another area, Macubeni near
Lady Frere, who are involved in a GEF funded Sustainable Land Management project, supported by
the Department of Environmental Science (DES) at Rhodes University.
Table 12: Practices being implemented in Mxumbu
Practice
Picture
*Trench bed Intercropping and mulching
A trench bed of 1m deep. An
intercropping of spinach, beans, carrot
and potatoes had been done. The idea
was to intercrop root crops with leaf
crops. Some of the heavy mulch which had
been applied had beenremoved,
following advice from aCSA team
member, as it was suppressing the growth
of the carrot seedlings.
Mixed cropping
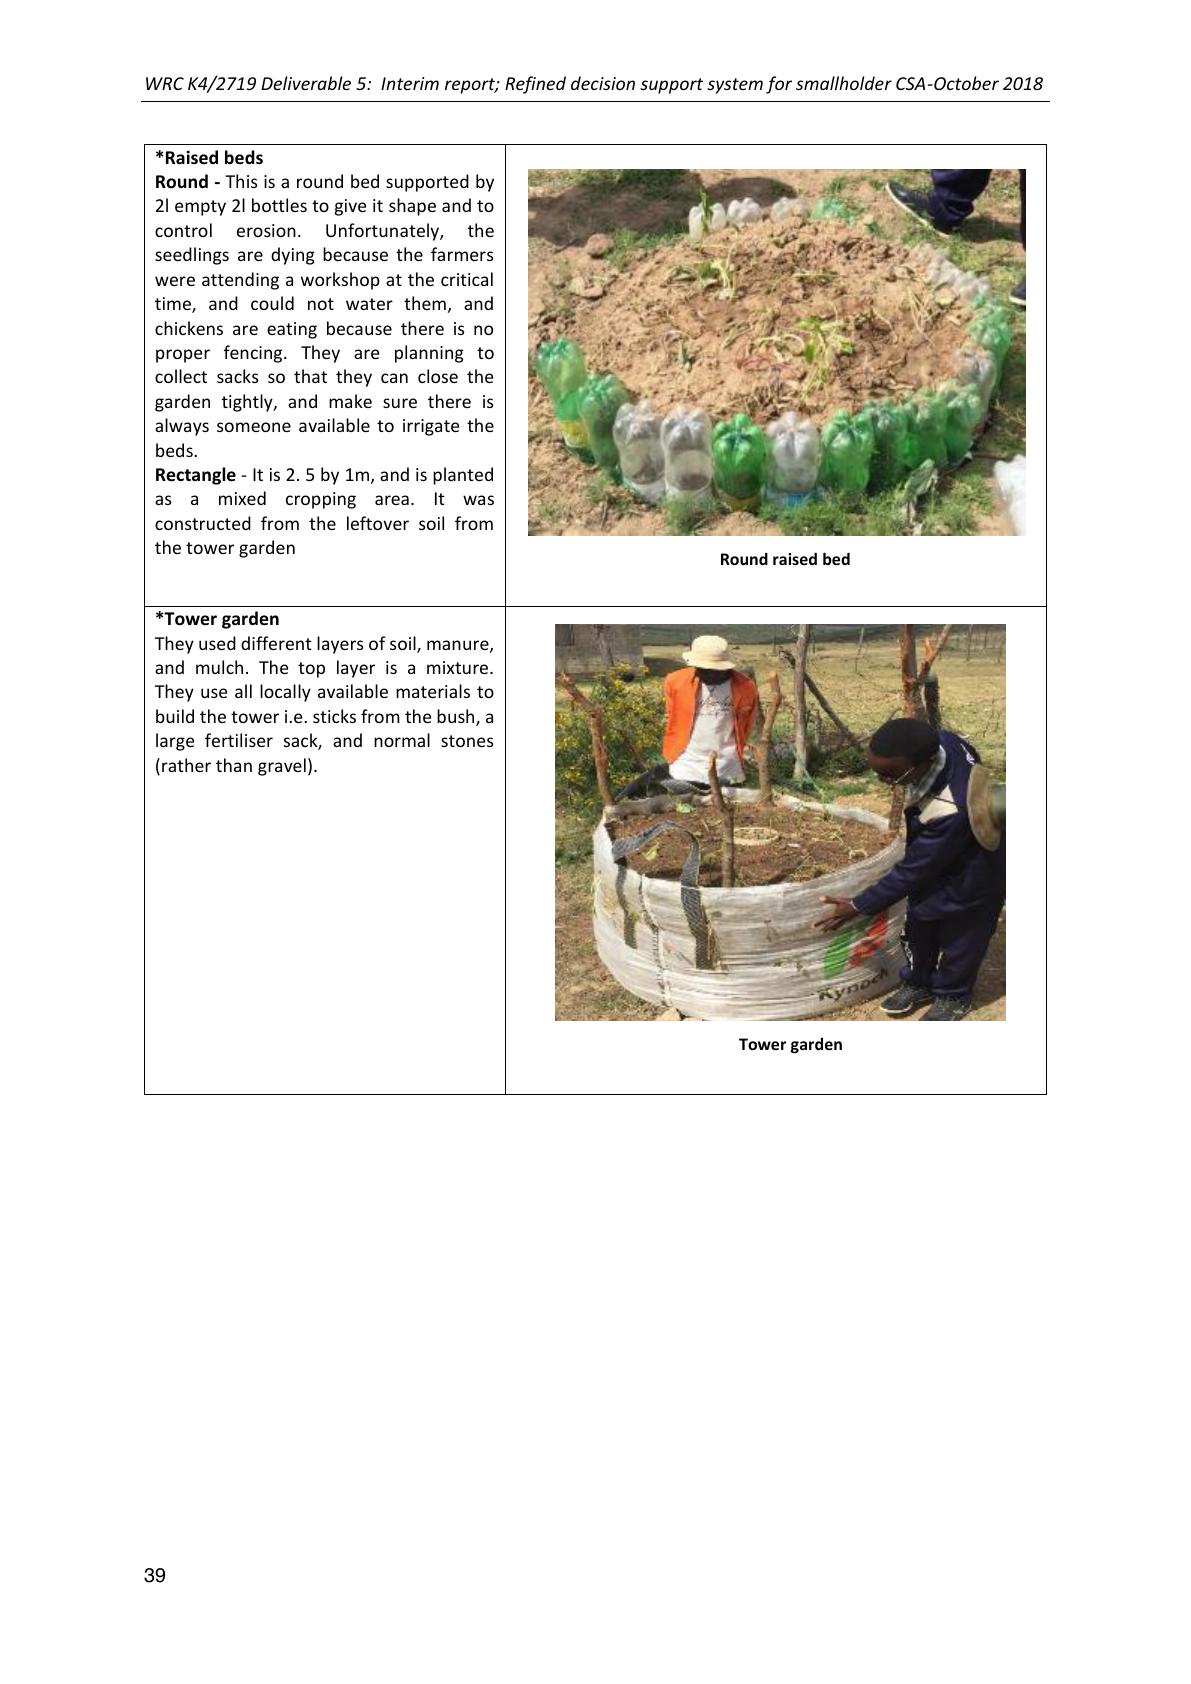
WRC K4/2719 Deliverable 5: Interim report; Refined decision support system for smallholder CSA-October 2018
39
*Raised beds
Round -This is a round bed supported by
2l empty 2l bottles to give it shape and to
control erosion. Unfortunately, the
seedlings are dying because the farmers
were attending a workshop at the critical
time, and could not water them, and
chickens are eating because there is no
proper fencing. They are planning to
collect sacks so that they can close the
garden tightly, and make sure there is
always someone available toirrigate the
beds.
Rectangle - It is 2. 5 by 1m, and is planted
as a mixed cropping area. Itwas
constructed from the leftover soil from
the tower garden
*Tower garden
They used different layers of soil, manure,
and mulch. The top layer is a mixture.
They use all locally available materials to
build the tower i.e. sticks from the bush, a
large fertiliser sack, and normal stones
(rather than gravel).
Tower garden
Round raised bed

WRC K4/2719 Deliverable 5: Interim report; Refined decision support system for smallholder CSA-October 2018
40
*Furrow irrigation
After they had been taught about furrow
irrigationthey conducted their own
experiment. The plot which is 22m by 12m
was prepared with 14 furrows. Along the
furrow ridges they planted black maize,
pumpkin, water melon, Bambara nuts,
sunflower, pearl millet, sorghum, and
popcorn maize. They planed beans onthe
furrow slopes.They realised that it is
difficult to get the bottom of the furrows
level over a long distance, so, following
advice, had halved the lengths. They are
planning to add manure onto the furrows
after harvesting. They like the open
furrows because they depend much on
rain water.
*Seed saving
The farmers had planted onions before
the winter, then they attended a
conference in Johannesburg where they
learnt about keeping onion seeds. They
came back home and make a decision not
to harvest the onions so that they can
produce and collect seeds. They had to
stick to the decision even when customers
want to buy the onions. They are planning
instead to sell onionseeds so that others
can grow their own crops.
Planting of herbs
On the first of November they made a
raised bed where they planted different
herbs. i.e. common mint, catmint,
marigold, nasturtium, garlic, and white
clover. The idea is to multiply these herbs
and transplant them among crops
throughout the garden to help control
pests and diseases. They want to get more
advice and do more research on which
vegetables should be planted together.
Handouts on mixed cropping was left with
the farmers.
(ii)Enterprise and market
•Spinach
The farmers here view farming as a business and they are selling spinach and other vegetables to
support theirlivelihoods. The spinach in thepicturesshow the crops grown in the tunnel and intrench
beds with bucket drip irrigation. These were planted in the first week of October and participants have
now sold more than 100 bunches, at R10 per bunch (27leaves).
Onions seed saving
Furrow irrigation
Herbs
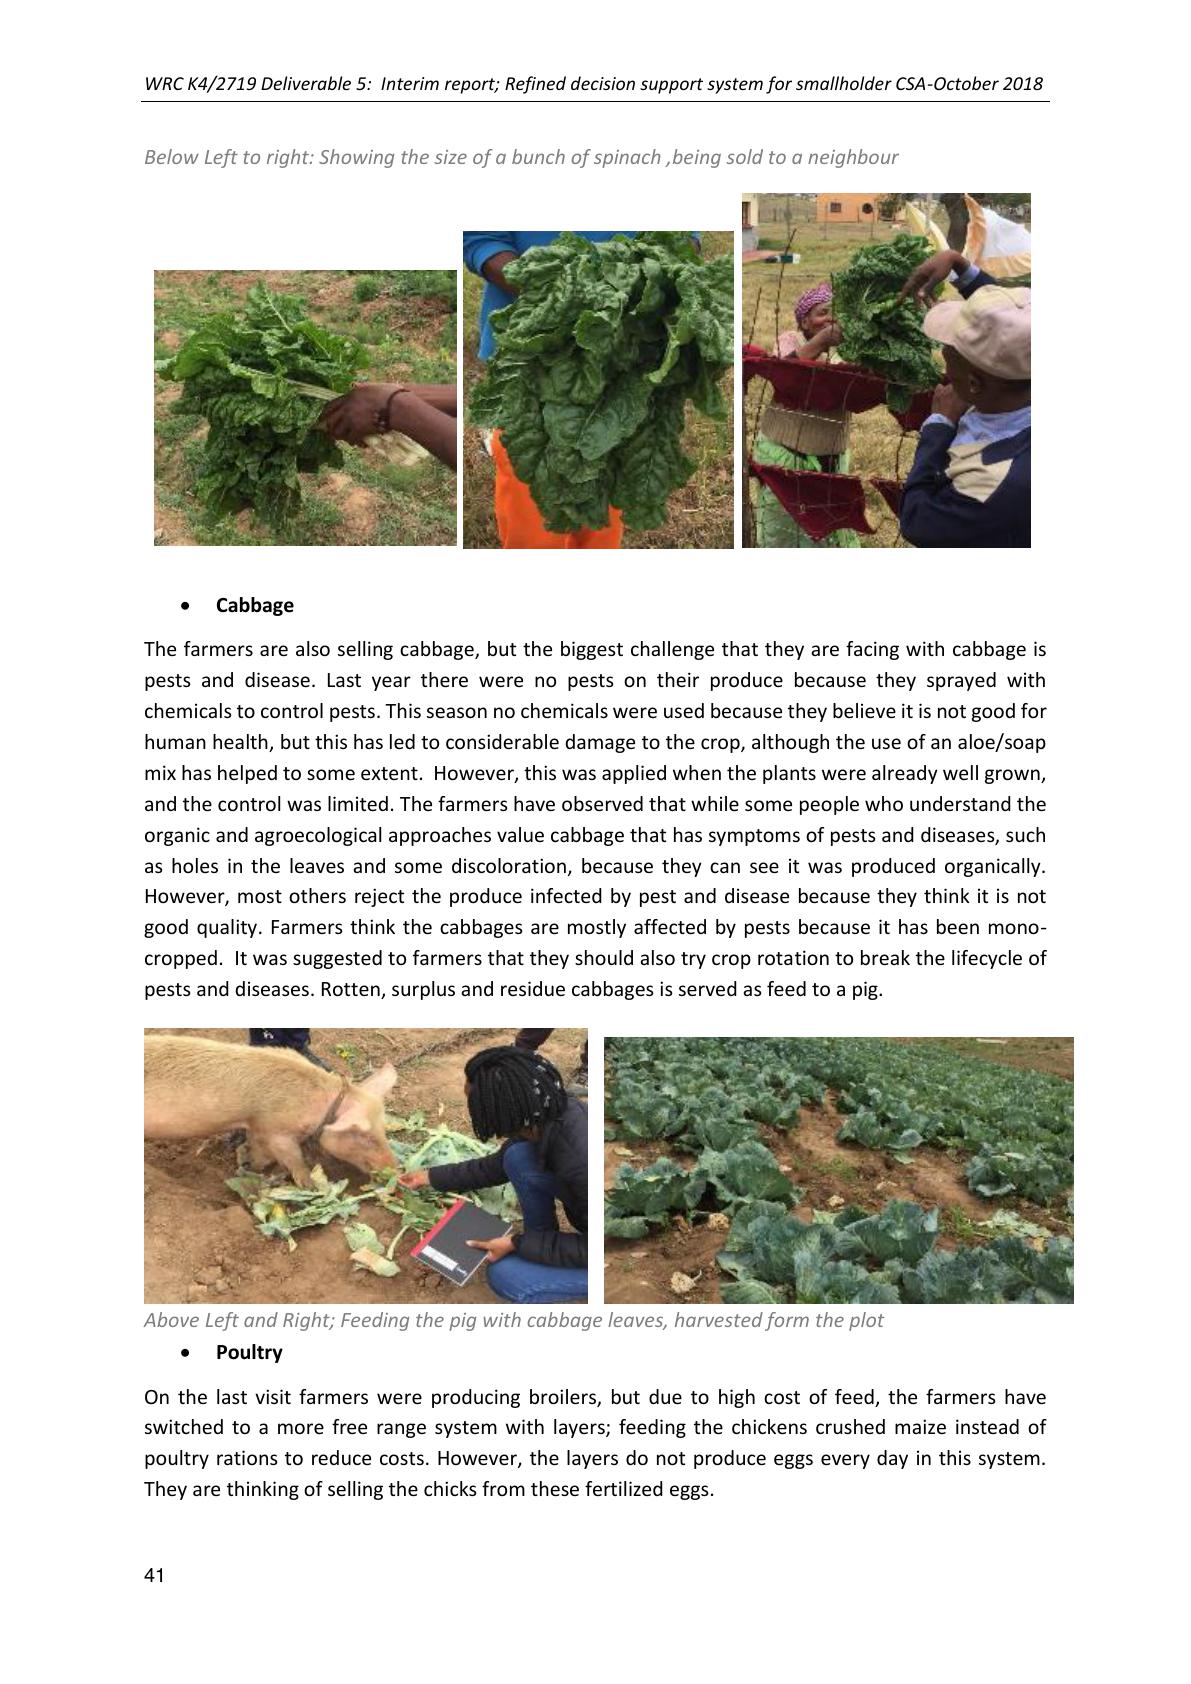
WRC K4/2719 Deliverable 5: Interim report; Refined decision support system for smallholder CSA-October 2018
41
Below Left to right: Showing the size of a bunch of spinach ,being sold to a neighbour
•Cabbage
The farmers are also selling cabbage, but the biggest challenge that they are facing with cabbage is
pests and disease. Last year there were no pests on their produce because they sprayed with
chemicals to control pests. This season no chemicals were used because they believe it is not good for
human health, but this has led to considerable damage to the crop, although the use of an aloe/soap
mix has helped to some extent. However, this was applied when the plants were already well grown,
and the control was limited. The farmers have observed that while some people who understand the
organic and agroecological approaches value cabbage that has symptoms of pests and diseases, such
as holes in the leaves and some discoloration, because they can see it was produced organically.
However, most others reject the produce infected by pest and disease because they think it is not
good quality. Farmers think the cabbages are mostly affected by pests because it has been mono-
cropped. It was suggested to farmers that they should also try crop rotation to break the lifecycle of
pests and diseases. Rotten, surplus and residue cabbages is served as feed to a pig.
Above Left and Right; Feeding the pig with cabbage leaves, harvested form the plot
•Poultry
On the last visit farmers were producing broilers, but due to high cost of feed, the farmers have
switched to a more free range system with layers; feeding the chickens crushed maize instead of
poultry rations to reduce costs. However, the layers do not produce eggs every day in this system.
They are thinking of selling the chicks from these fertilized eggs.

WRC K4/2719 Deliverable 5: Interim report; Refined decision support system for smallholder CSA-October 2018
42
(iii)CA Demonstration
From the initial demonstration conducted in August, the farmers haveconducted trainings to teach
other groups about Conservation Agriculture (CA);they have also already planted a 9m by 18m plot
of CA in their small garden. They have howeveralready tilled the plotoriginallydemarcated for the
CA demo. A small 5m by 5m demonstration was set up in one of the household gardens, although no
planting of seeds was done since the soil was too dry. The sowing process was explained in detail by
a member of the CSA team, and the seeds and other materials were handed out to the farmers to
conduct their experimentation after the rains arrive.
Above left and Right: the CA demonstration
explained and demonstrated
Day 3|Dimbaza|06/12/2018|
(i)Dimbaza-Infiltration pit and Diversion furrow
The site for this visit was the garden of Ms Aviwe Biko, another champion farmer experimenting with
a range of CSA practices and sharing her experiences with other farmers who are managing land in
the area. She has already constructed a range of differentlyshaped raised beds, trench beds and a
tower garden, and was keen to install the infiltration pit.
The purpose of the site visit was to make an infiltration pit and a diversionfurrow. An infiltration pit
is another name for an eco-circle or fertilitypit. The workshop started with anexplanation of the WRC
CSA project, and then the purposes of the pit and furrow were explained.The same procedure that
was used to make an Eco-circle at EQuzini was followed (see EQuzini, above). The following section
will give details on how the diversion furrow was made.
It was important that the furrow was positioned on a slight slope leading down to the infiltration pit.
In order to make sure that the slope was reasonable, and heading in the right direction, a line level
was constructed. However, the small spirit level, usually used to indicate the slope, was missing, so a
level was improvised out of a 300mm water bottle, half filled with water, and marked on either side
with a line indicting the line of the surface of the water when the line was level (horizontal). This kind
of level is not as precise as a spirit level, and is probably not accurate enough to be able to calculate
the angle of a slope with any degree of certainty, but it can indicate when the line is level (such as
along a contour), or which direction the ground is sloping, and whether the slope is gentle or steep. It
is therefore adequate for aligning diversion furrows. It is also something the farmers can easily make
for themselves. This makeshift line level was then used to identify the best line forthe diversion furrow
to follow, to bring water into the infiltration pit, and the furrow was constructed by the farmers with
the support of the CSA team.

WRC K4/2719 Deliverable 5: Interim report; Refined decision support system for smallholder CSA-October 2018
43
After completion of the task, in very hot weather with the temperature reaching 36°C, a plan was
agreed for a follow-up visit in 2019, and a range of handouts on infiltration pits, furrows,mixed
cropping and other practices was left with the farmers. Ms Biko was asked to take photos of the
infiltration pit every 2 weeks and send them through on WhatsApp to the CSA.
Above Left to Right; diversion furrow and infiltration pit implementation process
Conclusion and suggestions
In conclusion, the field visit went well. Farmers are passionate and they arelooking forward to take
the CSA practices to a larger scale. It is suggested to facilitate localised workshopsrather than choosing
central places where people find it far to attendtrainings and follow up meetings.Among local
communities where workshops will be conducted, it will work best to form solid CSA groups to avoid
always meeting new faces for every field visit taking place. As mentioned, farmers were encouraged
to keep forwarding photographs of practices on WhatsApp every two weeks to CSA team members.
A fieldvisit will be carried out next year in 2019 to monitor and implement more practices. One of the
practices that was suggested as the first priority for the next visit was the roof top rainwater
harvesting practice which will be implemented at Dimbaza.This practicehoweverneeds capital
investment and more research in terms of measurements in order to ensure accuracy. Lawrence (CSA
team member) is familiar with the practice, it has been implemented in theAmanzi for food project,
he will assist in facilitatingthe implementation of the practice. In the next visit we will alsolook at
other practices from the livestock and natural resources categories of the five fingers.
Eqeleni and Ezibomvini –Bergville- KZN
Written by Samukelisiwe Mkhize
Workshops were conducted in two villages(CCA workshops 1-4), Eqeleni and Ezibomvini where local
farmers were introduced to a range of CSA practices, including seedling production, eco-circles, trench

WRC K4/2719 Deliverable 5: Interim report; Refined decision support system for smallholder CSA-October 2018
44
bed preparations,mulching, intercropping and natural pest and disease control practices. Farmers
decided on their own which practices to experiment with from the above-mentioned practices, they
have observed the performance of the practices and provided some evaluation on crop quality, water
usage and saving qualities and management of the practices.
The farmers are able toself-assess the performance of these practices and make informed decisions
on which practices they would prioritize over others based on their experiential learning experiences,
and the performance of the practices. The graphand table below represent the mostand least
prioritized garden practices and the combination of practices implemented by participants in Eqeleni
and Ezibomvini. Monitoring was conducted for 12 participants who implemented these practices after
the workshops.
Figure 8: Implementation of CSA practices in gardening in the Bergville area- July-November 2018
The graph showsahigh percentage of participants experimenting with raised beds, a local practice,
as compared to trench beds.Farmers expressed that while they are aware ofthe differences in crop
quality and yield using the different practices, digging deep trenches is too laboriousfor some of them
to do alone. It was suggested to the participants that they should use the learninggroup as a resource
to find other participants who want to construct trench beds and work together. There are a relatively
high number of participants who have added mulch on their trench beds but some participants
expressed that while mulching has increased soil moisture on their raised beds and reduced the need
to irrigate too often, the practice requires regular maintenance and thatch attractstermites which eat
the crops. Theparticipants have also stressed the issue of pests and diseases that infect their green
pepper, spinach and cabbages. Some of the have tried using insect repellents such as, Blue Death and
Bulala Zonke with varying results.The participants are strugglingwith a host of pests,the most
common being:

WRC K4/2719 Deliverable 5: Interim report; Refined decision support system for smallholder CSA-October 2018
45
- Molerats
-Cutworms
- Birds
-Termites
-Diamond back moths (eats cabbages) and
- Snails
Right above: cabbage eaten by birds
Right below; green peppers showing insect feeding damage and
subsequent bacterial infections
Participants requested assistance with appropriate natural remedies
and also withidentification of different pests and disease. Not a lot
of emphasis is given to diseases in crops and participants are not
familiar with the different diseases common in their crops
Table 13: Shows the combination of practices implemented by participants in
Bergville
Trench
beds
Shallow
beds
Raised
beds
Mixed
cropping
Windbrea
ks
(Indigeno
us tree)
Seedling
productio
n
Liquid
manure
Eco-circle
RWH
Storage
Tunnel
Pest and
disease
control
Mulch
Phumelele
Hlongwane
✓
✓
✓
✓
✓
✓
✓
✓
✓
Zodwa Zikode
✓
✓
✓
✓
Nombono Zikode
✓
✓
✓
✓
Nonhlanhla
Zikode
✓
✓
✓
✓
✓
✓
✓
Ntombakhe
Zikode
✓
✓
✓
✓
✓
✓
Sdudla Sibiya
✓
✓
✓
Fikile Zikode
✓
✓
Sizeni Dlamini
✓
✓
✓
✓
Nomalanga
Khumalo
✓
✓
✓
Thulile Zikode
✓
✓
✓
✓
✓
Sibongile Zikode
✓
✓
✓
✓
✓
✓
✓
Gcinekile Zikode
✓

WRC K4/2719 Deliverable 5: Interim report; Refined decision support system for smallholder CSA-October 2018
46
The farmers wereprovided with Chinese cabbage, mustard spinach, kale, rape,spring onions, and
coriander, parsley and lavender seeds for seedling production to be later transplanted.This was a way
of introducing a number of new crops to the farmers and for them to assess these crops in terms of
growth and food value.During the monitoring process, we found that most of the farmers had not
harvested their produce, not transplanted the seedlings, and received low yields. The farmers had
mainly two issues, many of their vegetable gardens were poorly fenced or unfenced.Chickens had
invaded the gardensand ate the seeds, or they did not have enough water toirrigate their gardens.
These are commonissues, but the underlying issue is that they areunfamiliar with are unfamiliar with
the crops and especially the herbs (coriander, parsley and lavender).
Harvested crops were mainly Chinese cabbage, mustard spinach, kale and spring onions. The spring
onions were mainly harvested because the farmers cooked it with ‘isijabane’ (seepicture below) a
cultural maizemeal and spinach dishmadelocally. Their choiceof vegetable production crop varieties
is mainly influenced by their ability to sell these locally and use themfor household consumption.
A few participants are starting to use these herbs, adding them to stews and curries because they are
aware of the benefits of these herbs; mainly companion planting to controlpests and diseases. This
presents an opportunity for these participants to share their experiences with new participants who
do not know what to do with the herbs or unaware of the benefits. So far, there are a few incidents
were farmers are learning or sharing experiences together about challenges they are facing, in terms
of implementing the practices, especially amongst those with tunnels and those without. Participants
with tunnels have created their own ‘learning group’ assisting each other with planting, irrigation
techniques and harvesting, but those without tunnels often have no recourseto new information.
Above Left: Nonhlanhla Zikode (58yrs) from Ezibomvinihas made raised beds and uses thatch grass
for mulching. She removes the grass when she sees fungus starting to appear as she believes this
affects her crops/ Middle: A mixed crop and mulched bed and Right: Seedling production
Sedawa, Turkey- Mametja- Limpopo
Review and re-planning
Written by Erna Kruger and Betty Maimela
Date of workshop: 04 October 2018 (75 participants)

WRC K4/2719 Deliverable 5: Interim report; Refined decision support system for smallholder CSA-October 2018
47
(i)Agenda: Peer review and planning for the CSA innovation development programme–
(AgriSI) in the Lower Olifants.
This is a yearly event to review progress, tackle issues and broadly plan for the year going forward for
the learning groups involved. It also involves showcasing present successful activities and community
level discussion around issues and possible solutions.
TIME
Facilitator
Activity
Resources
9:00-9:30am
ERNA
Introduction; review of five fingers and general
comments for this season -
PP: data projector,
chords, screen
9:30-10:30
SYLVESTER,
BETTY
Small groups to work on practices they are using
under eachof the five fingers and report back to
plenary
Newsprint, kokis
10:30-11:00
ERNA
Compare this to the list of practices introduced in
the trainings and add these to the lists
PP presentation
11:00-12:00
ERNA,
SYLVESTER
Plenary for traffic lights, no of participants
implementing and also comments on these
practices (How much do they help)
12:00-1:00pm
ERNA
Presentation on experimentation and
measurements
Discussion on herb growers and how that is going
PP presentation
1:00-1:45pm
SYLVESTER,
BETTY
Small groups discuss experimentation and
practices for the next 6 months (summer season)
and make a list (with names of who will do those)
and report briefly to plenary
Including succession and continuity planning for
herb and veg sales.
Including new ideas… poultry…
Newsprint, Kokis
Announcements: Mango production training 29-31
October 2018
2:00-3:00pm
Christina,…
Visits to households
3:00pm
LUNCH
(ii)Report back from Ukuvuna cross visit
15 Participantsfrom these groups attendeda 3-day cross visit to the Ukuvuna learning sites in
Sekhukhune. Report backs were made by Alex Magopa and Christina Thobejane.
They talked about:
➢Tree propagation using cuttings: This method is used if you want aparticular tree type and do
not have seeds. It works for oranges, naartjies, peaches, grapes and roses. This is an in-situ
method where growing medium is tied onto the desired small branch and it is left there for
around 3 months until roots are formed, before the branch is cut away from the tree.
➢Us of tobacco for pest control: A brew is made from the young leaves only as the older leaves
are too strong.
➢An easy way to plant and harvest potatoes:Digging a ditch and planting the potatoes in there
and then filling this ditch as time goes along. It reduces the need for time consuming ridging
activities.
➢Youth are involvedthere, and it would be important to encourage our youth here also to do
farming
➢We can start having poultry, so that we can use the manure in the garden and for compost
and liquid manure instead of having to buy manure

WRC K4/2719 Deliverable 5: Interim report; Refined decision support system for smallholder CSA-October 2018
48
➢Many different herbs were shown and are being grown; including yarrow (for stress relief),
comfrey (for bones and liquid manure), parsley, coriander, wildmint (Mabele Mabutswa –for
pest control), Wild Dagga and geranium
➢A lot of different things were learnt as theirgardens are full of different kinds of crops.
However, we now have a market for our crops, which they do not.
➢They build seed houses, that they insulate on the inside using old egg boxes and they place
old sugar cane on top of the roof. A gutter is installed and the run-off collected. This sweet
water is used as a kind of liquid manure on the gardens. This sugar water will provide for very
sweet fruit from fruit trees.
➢Mixed cropping; alternate rows of Lucerne and vegetables –this is for soil fertility and also
saves water. Lucerne is very deep rooting and thus it can find water in the soil and does not
need that much watering.
➢Flowers can be planted for pest control in between vegetables; they also attract birds and
bees, which are needed for pollinating crops.
➢They also shared on the issue of livestock integration–feeding them from the garden and
using their manure in the garden- like a cycle. This was a highlight for us.
This visit encouraged us to put more effort into our farming, even if we do not have much water. Some
farmers there see farming as a full time job-they are busy in their gardens every day for the whole
day. Mr Malatjie asked that these participants try out some of the ideas, so that our learning groups
can also learn these techniques in that way and also that they share some of the seeds they were
given.
One of the fruit seeds that they brought with,
were strawberry seedlings which they bought
from one of the farmers they visited who
specialises in planting strawberries. Trona
Morema, planted them inside her tunnel,
where she made a shallow trench bedthat
she built using cement bricks. See the picture
alongside.
(iii)Mango production household visits
A fewparticipants in Lepelle and Sedawa were visited by Jeffery Tshishonga, a farm manager at
Landman Group the commercial Mango estates (Bavaria), so that he could give them advice on mango
tree management and also check on issues with deficiencies, pests and diseases. This information will
also be useful in designing the upcoming Organic Mango Production training, organised through the
Hoedspruit Hub for the (29-31 October 2018).
Report backs from the participants visited by Jeffry Tshisonga highlighted input on pruning –both
water shoots, and excessive branches to ensure that all flowers have access to sunlight. This increases
fruiting substantially. Also, the tips of the branches that bear fruit are pruned in winter to stimulate
more fruiting branches. He emphasised that pruning shears should be used for straight clean cuts and
not the pangas people havebeen using. He spoke to irrigation and suggested they build basins around
their trees to allow for around 200-400l of irrigation in one go. Watering like this needs to be done
once a week or bi-weekly. Also the leaves that fall form the trees should not be swept away but placed
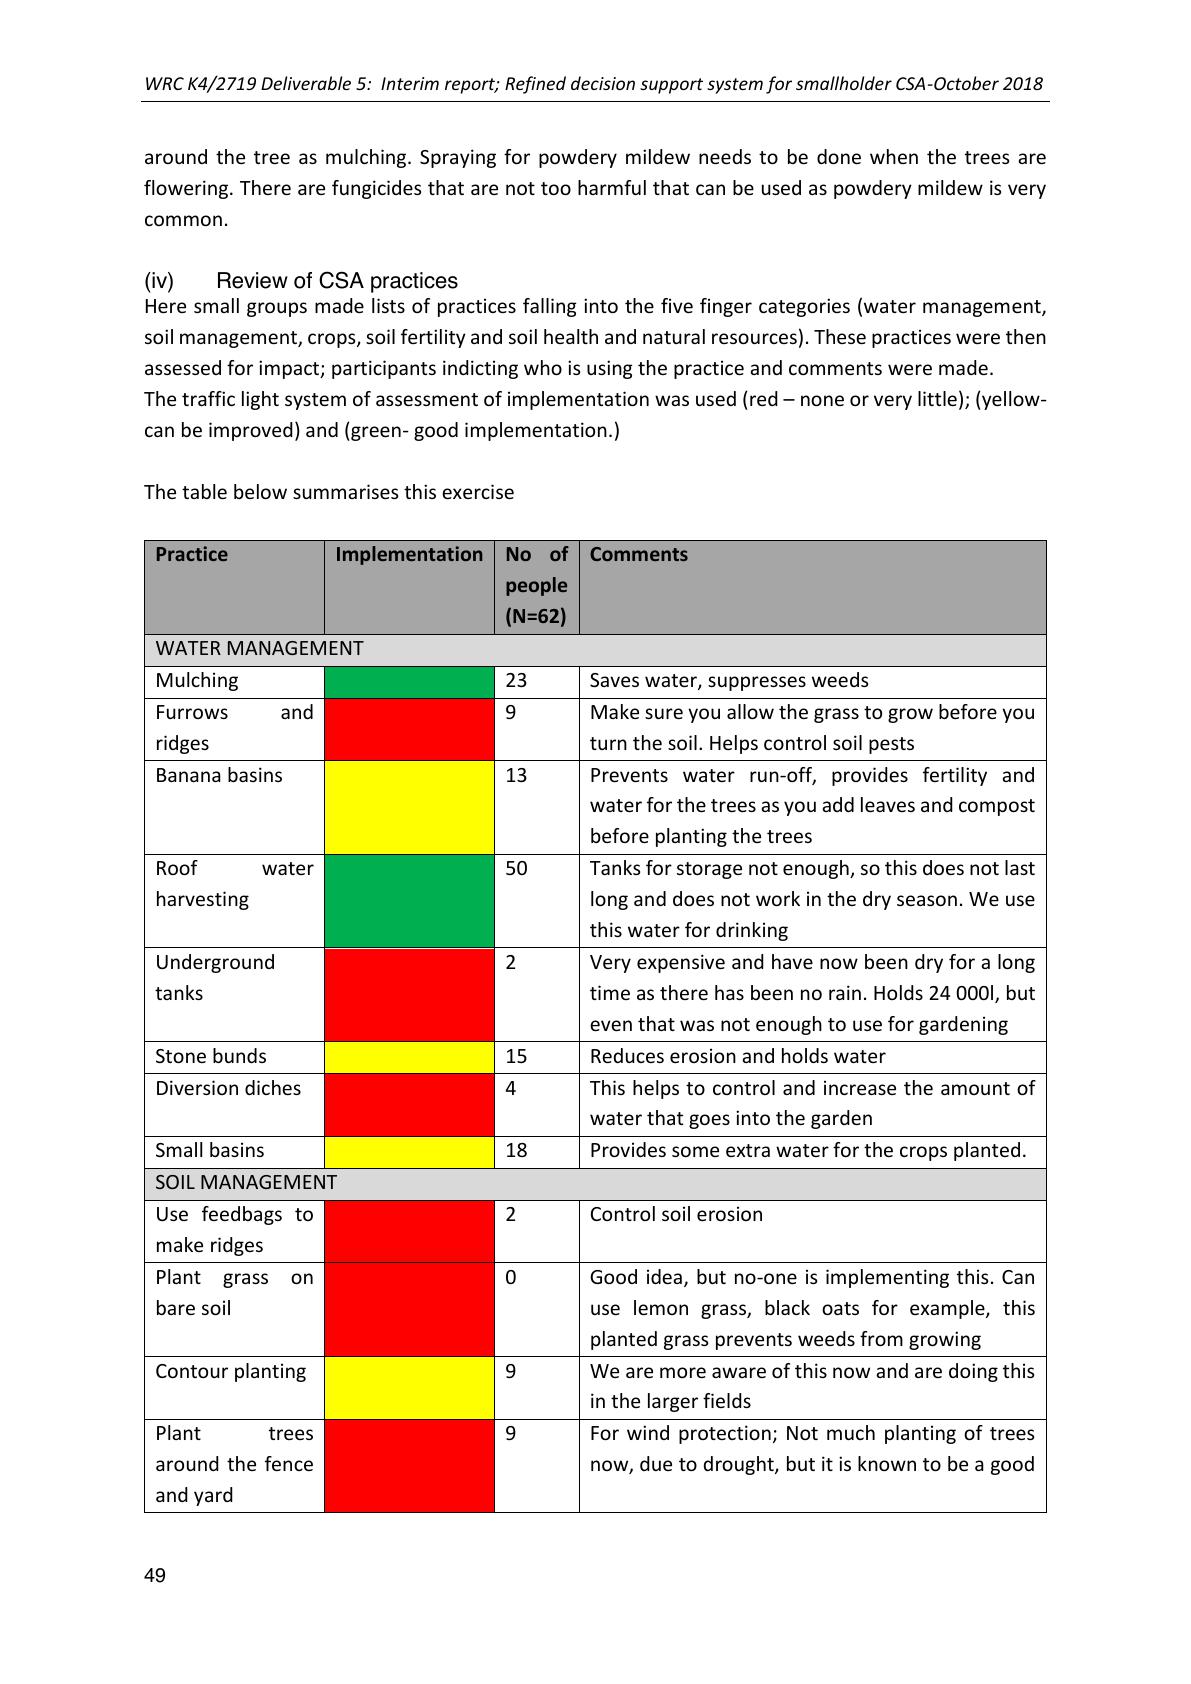
WRC K4/2719 Deliverable 5: Interim report; Refined decision support system for smallholder CSA-October 2018
49
around the tree as mulching. Spraying for powdery mildew needs to be done when the trees are
flowering. There are fungicides that are not too harmful that can be used as powdery mildew is very
common.
(iv)Review of CSA practices
Here small groups made lists of practices falling into the five finger categories (water management,
soil management, crops, soil fertility and soil health and natural resources). These practices were then
assessed for impact; participants indicting who is using the practice and comments were made.
The traffic light system of assessment of implementation was used (red –none or very little); (yellow-
can be improved) and (green- good implementation.)
The table below summarises this exercise
Practice
Implementation
No of
people
(N=62)
Comments
WATER MANAGEMENT
Mulching
23
Saves water, suppresses weeds
Furrows and
ridges
9
Make sure you allow the grass to grow before you
turn the soil. Helps control soil pests
Banana basins
13
Prevents water run-off, provides fertility and
water for the trees as you add leaves and compost
before planting the trees
Roof water
harvesting
50
Tanks for storage not enough, so this does not last
long and does not work in the dry season. We use
this water for drinking
Underground
tanks
2
Very expensive and have now been dry for a long
time as there has been no rain. Holds 24 000l, but
even that was not enough to use for gardening
Stone bunds
15
Reduces erosion and holds water
Diversion diches
4
This helps tocontrol and increase the amount of
water that goes into the garden
Small basins
18
Provides some extra water for the crops planted.
SOIL MANAGEMENT
Use feedbags to
make ridges
2
Control soil erosion
Plant grasson
bare soil
0
Good idea, but no-one is implementing this. Can
use lemon grass, black oats for example, this
planted grass prevents weeds from growing
Contour planting
9
We are more aware of this now and are doing this
in the larger fields
Plant trees
around the fence
and yard
9
For wind protection; Not much planting of trees
now, due to drought, but it is known to be a good

WRC K4/2719 Deliverable 5: Interim report; Refined decision support system for smallholder CSA-October 2018
50
idea. Plant any kind of no fruiting tree to protect
the fruit trees in the yard.
CROP MANAGEMENT
Correct timing of
irrigation
7
Early mornings or late afternoons-this reduces
stress and wilting
Planting sweet
potatoes
15
Works well on ridges and furrows and works even
in these hot, dry conditions –but needs some
watering
Tunnels (shade
houses)
10
These work extremely well and all participants are
interested
Bulbinella
3
To trap water and is used for medicinal purposes
(introduced by MDF)
Using organic
pest control
remedies
15
Chilli and aloe and liquid manure works well. Not
many pests seen
Liquid manure
10
Use black jack leaves, chicken and goat manure –
works well
Keep loosening
the soil
27
Traditional practice–( infact not recommended
for soil health and soil structure-causes
compaction, and capping)
Drip irrigation
10
Helps to use less water and save the water
especially if mulching also used. Plants grow well
Use of herbs in-
between veggies
21
This is now becoming common practices. It helps
for pest control, water management
Trench beds
28
They make a big difference –good looking crops,
big and healthy
Shallow trenches
16
Easier than trenches with a similar result. Can be
done on larger areas
Compost
4
Labour intensive, not enough water
Use of manure
62
We all now use manure and understand that the
soil needs to be fed
NATURAL RESOURCES
Less cutting of
trees
62
We are all aware and trying to save the trees
Minimising veld
fires
62
We are all aware and are not burning veld
Planting of
indigenous trees
26
We are all aware and are doing this on a small
scale in our yards
(v)Presentation of experimentation results
A power point presentation was given (Attachment 1: AWARD-AgriSICluster Review Workshop-
October 2018)that outlines the results of the experiments in the tunnels (trench beds inside and
outside the tunnel and also furrows and ridges outside the tunnel). It was shown that the water

WRC K4/2719 Deliverable 5: Interim report; Refined decision support system for smallholder CSA-October 2018
51
productivity is much higher inside the tunnels and also how this is substantially increased when deep
watering and mulching is used. A cost benefit analysis showing the amount of profit possible for a
tunnel was also shown (R900 for 3-4 months), using spinach as an example.
A presentation was also done on the organic marketing of vegetables and herbs. Participants
explained to the group how the process works and some results of incomes made and specific crops
sold were presented.Hoedspruit Hub has tried out a number of different avenues for marketing –
each with their own positives and negatives, described briefly in the small table below.
Market
Requirements
Local restaurants and health
shop
Small quantities, can deal with some variability of crops, but
quality must be good
Veggie boxes; facebook page
Medium quantities; quality must be good, required regular supply
and lots of different crops
Supermarkets(Lebamba,
PicknPay)
Larger quantities; lower price, continuityof supply is absolutely
crucial
Friends and individuals
Small quantities, will more likely take what is available,
Saturday farmers market and
boot car sales
Tested dried herbs and pesto as well as vegetables. –Small
quantities need good quality and regular supply.
It wasdiscussed that thesewere all aninitial testing of the market in Hoedspruit and that the farmers’
desired market of supermarkets could in fact be the most difficult and least rewarding as these buyers
want contracts, large and continual supply and pay less. At the moment farmers are getting high prices
as produce is sold as organic and directly to consumers.
Crops with a HIGH demand: flat leaf parsley, basil, onions, spinach, beetroot, green beans,
sweet potatoes
Crops with GOOD demand (smaller quantities): curly leaf parsley, coriander, fennel, cabbage,
Crops with LOW demand: local tomatoes (the buyers do not like the variability in size and
shape of the tomatoes)
New crops to focus on: baby marrows, carrots
Suggestions for more participants to come on board (at the moment 10-15 participants only):
➢There has to be quality control at the village (learning group) level before produce is taken
to the market.
➢Planting intervals are important; so you have to plant regularly and not wait for everything
to be harvested before planting again. We need to set up planting calendars for all the
groups
➢Protect the market by providing good quality and sticking to the requirements (borehole
water for washing, correct weights and packaging
➢Each village must make a plan -types of herbs and vegetables
➢Number of people
oSedawa: 13
oLepelle: 2
oTurkey: 9
oFenale: 5
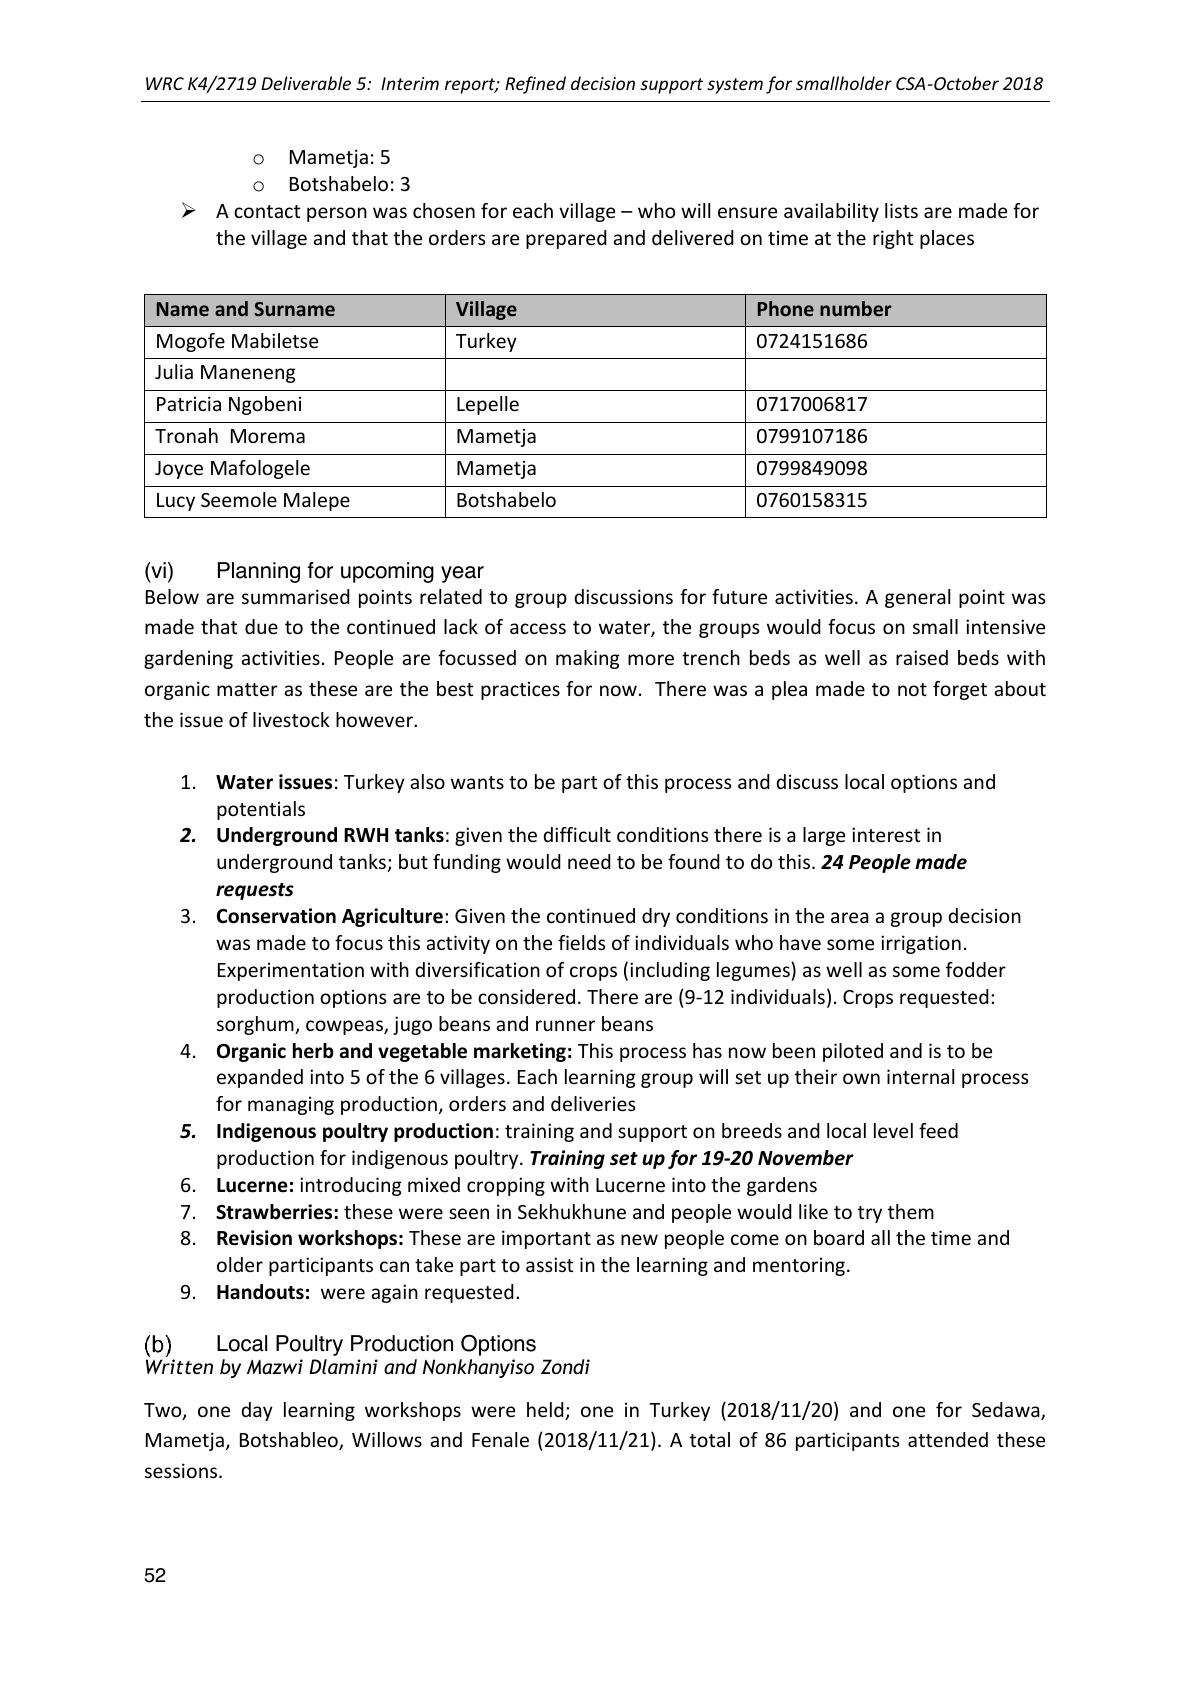
WRC K4/2719 Deliverable 5: Interim report; Refined decision support system for smallholder CSA-October 2018
52
oMametja: 5
oBotshabelo: 3
➢A contact person was chosen for each village –who will ensure availability lists are made for
the village and that the orders are prepared and delivered on time at the right places
Name and Surname
Village
Phone number
Mogofe Mabiletse
Turkey
0724151686
Julia Maneneng
Patricia Ngobeni
Lepelle
0717006817
Tronah Morema
Mametja
0799107186
Joyce Mafologele
Mametja
0799849098
Lucy Seemole Malepe
Botshabelo
0760158315
(vi)Planning for upcoming year
Below are summarised points related to group discussions for future activities. A general point was
made that due to the continued lack of access to water, the groups would focus on small intensive
gardening activities. People are focussed on making more trench beds as well as raised beds with
organic matter as these are the bestpractices for now. There was a plea made to not forget about
the issue of livestock however.
1. Water issues: Turkey also wants to be part of this process and discuss local options and
potentials
2. Underground RWH tanks: given the difficult conditions there is a large interest in
underground tanks; but funding would need to be found to do this. 24 People made
requests
3. Conservation Agriculture: Given the continued dry conditions in the area a group decision
was made to focus this activity on the fields of individuals who have some irrigation.
Experimentation with diversification of crops (including legumes) as well as some fodder
production options are to be considered. There are (9-12 individuals). Crops requested:
sorghum, cowpeas, jugo beans and runner beans
4. Organic herb and vegetable marketing: This process has now been piloted and is to be
expanded into 5 of the 6 villages. Each learning group will set up their own internal process
for managing production, orders and deliveries
5. Indigenous poultry production: training and support on breeds and local level feed
production for indigenous poultry. Training set up for 19-20 November
6. Lucerne: introducing mixed cropping with Lucerne into the gardens
7. Strawberries: these were seen in Sekhukhune and people would like to try them
8. Revision workshops: These are important as new people come on board all the time and
older participants can take part to assist in the learning and mentoring.
9. Handouts:were again requested.
Local Poultry Production Options
Written by Mazwi Dlamini and Nonkhanyiso Zondi
Two, one day learning workshops wereheld; one in Turkey (2018/11/20) and one for Sedawa,
Mametja, Botshableo, Willows and Fenale (2018/11/21). A total of 86 participants attended these
sessions.

WRC K4/2719 Deliverable 5: Interim report; Refined decision support system for smallholder CSA-October 2018
53
Here issues of housing, feeding, poultry health and different breeds were discussed. In addition, the
groups went through a budgeting exercise for broilers and layers and different feeding schedules and
regimes were presented.
Below small snapshots of the information presented and discussed are outlined.
(i)Feeding Chickens
Chickens are the same as humans; they also need a balanced diet which will allow them to grow to
their full potential. Herbs such as Comfrey, Fennel, and Thyme etc play an important role in the diet
of the chicken. Grains like sunflower are also needed to balance the diet. But the most important part
in chicken feed is the protein which they get from grubs. Grubs are required for body fat and they are
a very good source of protein. It’s like a full meal e.g. pap, meat and spinach or cabbage.
If hens eat their own eggs, it is a sign that they are not getting the right nutrients, not enough calcium
and not enough protein. Although it is recommended that eggshells are crushed and used in the feed,
this can actually promote the practices of eating eggs and so grit and seashells are used instead.
Commercial feeds such as grower and finisher are used for broilers and layers. The three-phase
feeding that includes post finisher is done to clear out the vaccines and other additivesin the feed
prior to marketing
For commercialproductionand working with broilers and layers one has to stick very strictly to the
timing and feeding, so that the broilers can be ready after 5 weeks and layers are able to lay on average
1 egg/hen/day. If this is not done,the very small profit margin in poultry production can be lost. It is
also advisable to keep at least 100 chickens at a time for commercial production. Working with smaller
batches is generally not profitable
Below is a table of costs.
ITEM
COST
100 1st Grade Chicks per box (including ND&IB sprays
and chick box)
R740
2 phase feeding programme
0-21 days starter
22-36 days finisher
37-42 post finisher
R360 x 2=R720
R340 x 5=R1700
R320 x 1=R320
3 phase feeding programme
0-14 days starter
15-36 days grower
37-42 days finisher
R360 x 1=R360
R340 x 3=R1020
R340 x 3=R960
R320 x 1-R320
Drinker
R62 x 3=R186

WRC K4/2719 Deliverable 5: Interim report; Refined decision support system for smallholder CSA-October 2018
54
Feeder
Day old
R40 x 3=R120
2 phase feeding
R3046
3 phase feeding
R2966
(ii) Housing
Chickens are very sensitive to
diseases. They need to be kept in
a clean environmentand be
provided with clean drinking
water daily. They also need to be
kept warm/cool depending on
weather. So rondavels, or shaded
areas are a good place to keep
them. It is also possible to keep
them in moveable arcs or chicken
tractors, as this way they can
scratch and feed on bugs and also
fertilize the soil for you while
being moved regularly to a new
area that provides foodand a
clean environment for them. This
dramatically reducesthe
incidence of mites and ticks on poultry
The groups also built chicken tractors as a part of the learning process
Right and far right; Chicken
tractors being constructed
in turkey and Sedawa
respectively.
Chicken tractors of this
size can house around
10 chickens. Take care
to only have 1rooster
in any one enclosure. If
there are more, they
compete and may kill
chicks that are born.
(iii) Health
A session was also spent on discussing poultry diseases and how to control these. The main way of
controlling diseases is vaccination. In terms of prevention, one needs to remove sick chickens as soon
as possible from the rest, as diseases generally are spread between the birds.
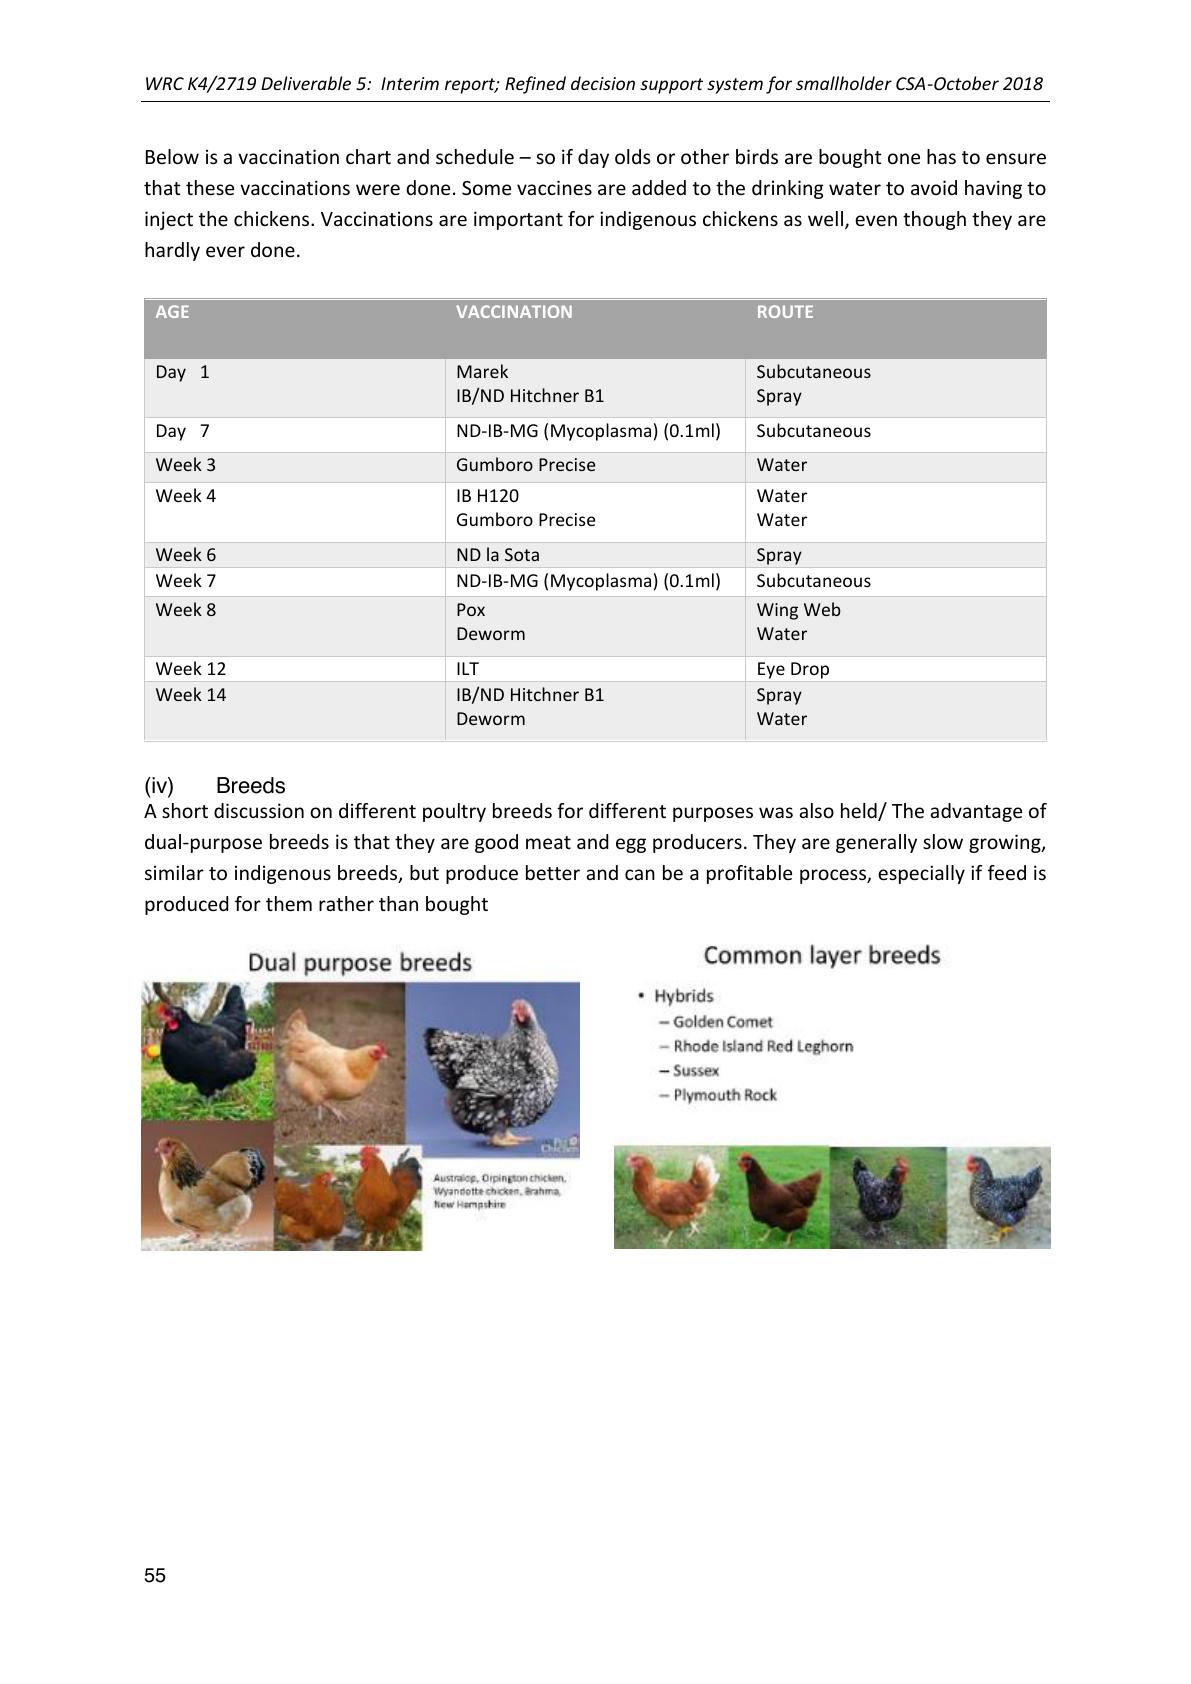
WRC K4/2719 Deliverable 5: Interim report; Refined decision support system for smallholder CSA-October 2018
55
Below is a vaccination chart and schedule –so if day olds or other birds are bought one has to ensure
that these vaccinations were done. Some vaccines are added to the drinking water to avoid having to
inject the chickens. Vaccinations are important for indigenous chickens as well, even though they are
hardly ever done.
AGE
VACCINATION
ROUTE
Day 1
Marek
IB/ND Hitchner B1
Subcutaneous
Spray
Day 7
ND-IB-MG (Mycoplasma) (0.1ml)
Subcutaneous
Week 3
Gumboro Precise
Water
Week 4
IB H120
Gumboro Precise
Water
Water
Week 6
ND la Sota
Spray
Week 7
ND-IB-MG (Mycoplasma) (0.1ml)
Subcutaneous
Week 8
Pox
Deworm
Wing Web
Water
Week 12
ILT
Eye Drop
Week 14
IB/ND Hitchner B1
Deworm
Spray
Water
(iv) Breeds
A short discussion on different poultry breeds for different purposes was also held/ The advantage of
dual-purpose breeds is that they are good meat and egg producers. They are generally slow growing,
similar to indigenous breeds, but produce better and can be a profitable process, especially if feed is
produced for them rather than bought

WRC K4/2719 Deliverable 5: Interim report; Refined decision support system for smallholder CSA-October 2018
56
3NEW EMPHASIS: WATER ISSUES
Some follow-ups have been made during this period, in preparation for the trainingand
implementation around spring protection, and water storage and reticulation for agricultural usein
2019.
Water issues follow-up- Limpopo
Lepelle
Very little progresshas been made in Lepelle, as the water committee has floundered under the
political instability caused in the village due to strife caused by lobbying in the area to change the
traditional authority and headmen for the area. Community members have not contributed as agreed
and thus MDFis unable to take the next step in the process. The agreement was that MDFwould
match whatever contributions the community made, so that the first steps in renovation of the furrow
can be made. No progress has been made in the community to deal with water leakages caused by
broken pipes and joins.
Sedawa
Here Raymond Vonk, a hydrological engineer specialising in borehole surveying (geophysical services),
was employed by MDF to do a survey of three potential borehole sites for the Sedawa community
(2018/10/07). He produceda report clearly indicatingthree potentialsites along the three lines
suggested by the community. This will be reported back to the learning group and water interest group
so that the next steps can be taken.
Figure 9: Assessment of Line 2 for borehole options. This line is close to the river in Sedawa and thus also has the
greatest possibility of finding a strong source without deep drilling

WRC K4/2719 Deliverable 5: Interim report; Refined decision support system for smallholder CSA-October 2018
57
Suitable sites were found along all three of the lines, although the line close to the mountains above
the village, likely would need to have a deeper hole drilled. Mr Vonk suggested the community
members find out from others the average depth of drilling forthe area. He was unable to conduct his
usual electromagnetic survey to access this dueto the presence of too many fence lines inthe vicinity,
which interferes with these measurements. Mr Vonk also offers remote assistance when boreholes
are drilled to access the condition of the rock and slurry being removed, to be able to advice whether
the hole should be drilled deeper or not.
Turkey
In this village learning group members have met independently and decided on a process for saving
towards drilling of joint boreholes for agricultural water provision. They have suggested that MDF
meets with them once they have collected enough funds to assist them with planning and siting of
these boreholes. In addition, Chris Stimie produced a more detailed budget for the two water
provision options (reticulation from the mountain spring and the boreholes).
Water issues follow-up –Bergville
For both viallges, Ezibomvini and eqlqeni, initial workshops and field assessments have been done to
assess the need and potential. Learning groups have undertakento start collecting contributions from
their groups and to plan an implementation process after discussion of the small reports produced by
Mr Chris Stimie who attended these processes with a view to proposing themost beneficial and
appropriate interventions.
Ezibomvini
Written by Chris Stimie
(i)Ezibominivillage: Spring development proposal
Figure 10: Springs visited in Ezibomvini

WRC K4/2719 Deliverable 5: Interim report; Refined decision support system for smallholder CSA-October 2018
58
Description:
The Google Earth image above indicates the 4 springs that were visited on 7August 2018. The red line
indicates the possible pipe route from the springs to the indicated household. The distance of the pipe is
about 400m, depending on the exact route and the height difference is about 10m.
The cheapest and easiest option for extracting water from the spring is to install a slotted pipe (see photo
below) close to the eye of the spring and cover it with gravel and soil. From this slotted pipe a black plastic
pipe (HDPE)canbe linked to take the water toplastictank at the selected household. The older, abandoned
spring (#4) could be used for that. The spring needs to be excavated to ensure that it will give the best yield
possible. The other spring that is used by many villagers will therefore be available as before.
The way the spring is protected means that the spring will be almost invisible after the construction and
contamination by cattle will also be eliminated. If there is a need to provide water for cattle that can be
done with an outlet from the pipe.
Right:A well manufactured slotted pipe: 63 mm PVC pipe with 1mm slots every 7mm
It is recommended that a 40mm HDPE, Class 6 pipe is used from the spring to the
proposed plastic tank (5000 l) This pipe would be able to give about 3000 litres of
water per hour with a 10m height difference. The tankshould fill up in less than2h.
The houses on the other side of the hill will also be serviceable with water fromthe springs. A small tank
could be installed to buffer the flow of the spring, or the water could be available at a tap under gravity.
The pipe should be fitted with a valve before the inlet to the tank for easy management of the water.
Estimated costs:
The slotted pipe and related fittings: R300 (The slotted pipe itself will be supplied free of charge)
Gravel and geotextile to cover the gravel: R500
Pipe (40mm HDPE/6) 400m @ R14.50/m : R5 800 (Plus another 450m to the other side)
Trench digging and back filling for pipe Installation @ R200/10m: R8 000
Joints for the pipe: R500
Fittings at the tank: R800
Plastic tanks (5000 l& 2000 l) R9 000
Tank platform (built locally with bricks and concrete floor): R2 000
The spring is excavated to expose the eye/s in a
round shape. A layer of gravel is placed on the
floor. The slotted pipe system is connected to
the main pipe to the tank.
The low concrete wallis then constructed as indicated.
The pipes are coveredby gravel and on top of the gravel
a geotextile is placed. The geotextile is covered by topsoil
and the spring will be protected against animals and
most vandals.

WRC K4/2719 Deliverable 5: Interim report; Refined decision support system for smallholder CSA-October 2018
59
Unforeseen: R3 100
Total: R30 000
If the distribution to the 10 selected Households are added, there will be additional costs. This estimate is
based on the assumption that each HH will have a pipe of 300m linked to it in the distribution network from
the tank. The cost of a 25mm HDPE pipe (Class 10 –lowest class available) is R8.6 /m. That gives a cost of
R26 000. If the installation cost is R10/m the total will be R56 000. Fittings and other costs could be taken
as R4 000 which will make the total R60 000. One size could be used for simplicity. This will total to R90 000
Note: From experience management of taps are problematic as people (especially children) tend to leave
them open which will empty the tank in a short period of time. The effective management of taps is crucial
to the successful use of the system.
Eqeleni
Written by Chris Stimie
Eqeleni Village –alternative water supply
Figure 11: Taps and water points in Eqeleni village
Description of problem
This village has afairly reliable water supply system that was installed
more than 10 years ago. The municipal taps are in daily use and are
an important source of clean water for the village. These taps are fed
from Emmaus where there is a borehole and a pump supplying the
villages in the vicinity.

WRC K4/2719 Deliverable 5: Interim report; Refined decision support system for smallholder CSA-October 2018
60
There are a few problems with it. Firstly the taps are sometimes dry when the borehole pump is not
working. Secondly the taps are about 400m apart, next to the road only -which makes it quite far for
women to cart water for their household. Lastly the areas around the taps are trampled and very muddy
which makes it prone to waterborne diseases.
There were plans in the past to do reticulation from the main line to households, but that never came to
fruition.
There are also springs in the area. From discussions
it became clear that these springs were used as
source of water many years ago. At the moment it
seems that they are usedby cattle mainly. These
springs are in the valley andare much lower than the
households.
Possible interventions
The need for reticulationof waterwas strongly
expressed by the community and the validity for this need is obvious. This unfortunately is outside the
scope of this project.
Intervention 1:
The areas around the taps could be improved by a concreteslab with drains leadingexcess water away
and providing cattle a cleaner facility to drink water.
Cost: About R8 000 per tap for concrete work.
Intervention 2:
Thesprings could be developed and water could be pumped into a reservoirat a suitable position and
elevation. The households are all higher (between 5 and 20 m) than the springs pumping will be needed.
As electricity is not available at the springs it will have to be provided or diesel or solar will have to be
used as a power source. Apart from the relatively high cost the vulnerability for vandalism or theft is very
high. The effective operation and maintenance of these mechanical systems are also of concern.
In terms of pumps a few options do exist. A common approach is to use a portable diesel or petrol pump-
unit. These pumps are about R18 000 for a diesel unit and R8 000 for a petrol unit. The flow rates are very
high –maximum 30 000 liters per hour and they cost roughly R15 to R25 per h to operate. They can be
transported with a wheel barrow. This option is not recommended.
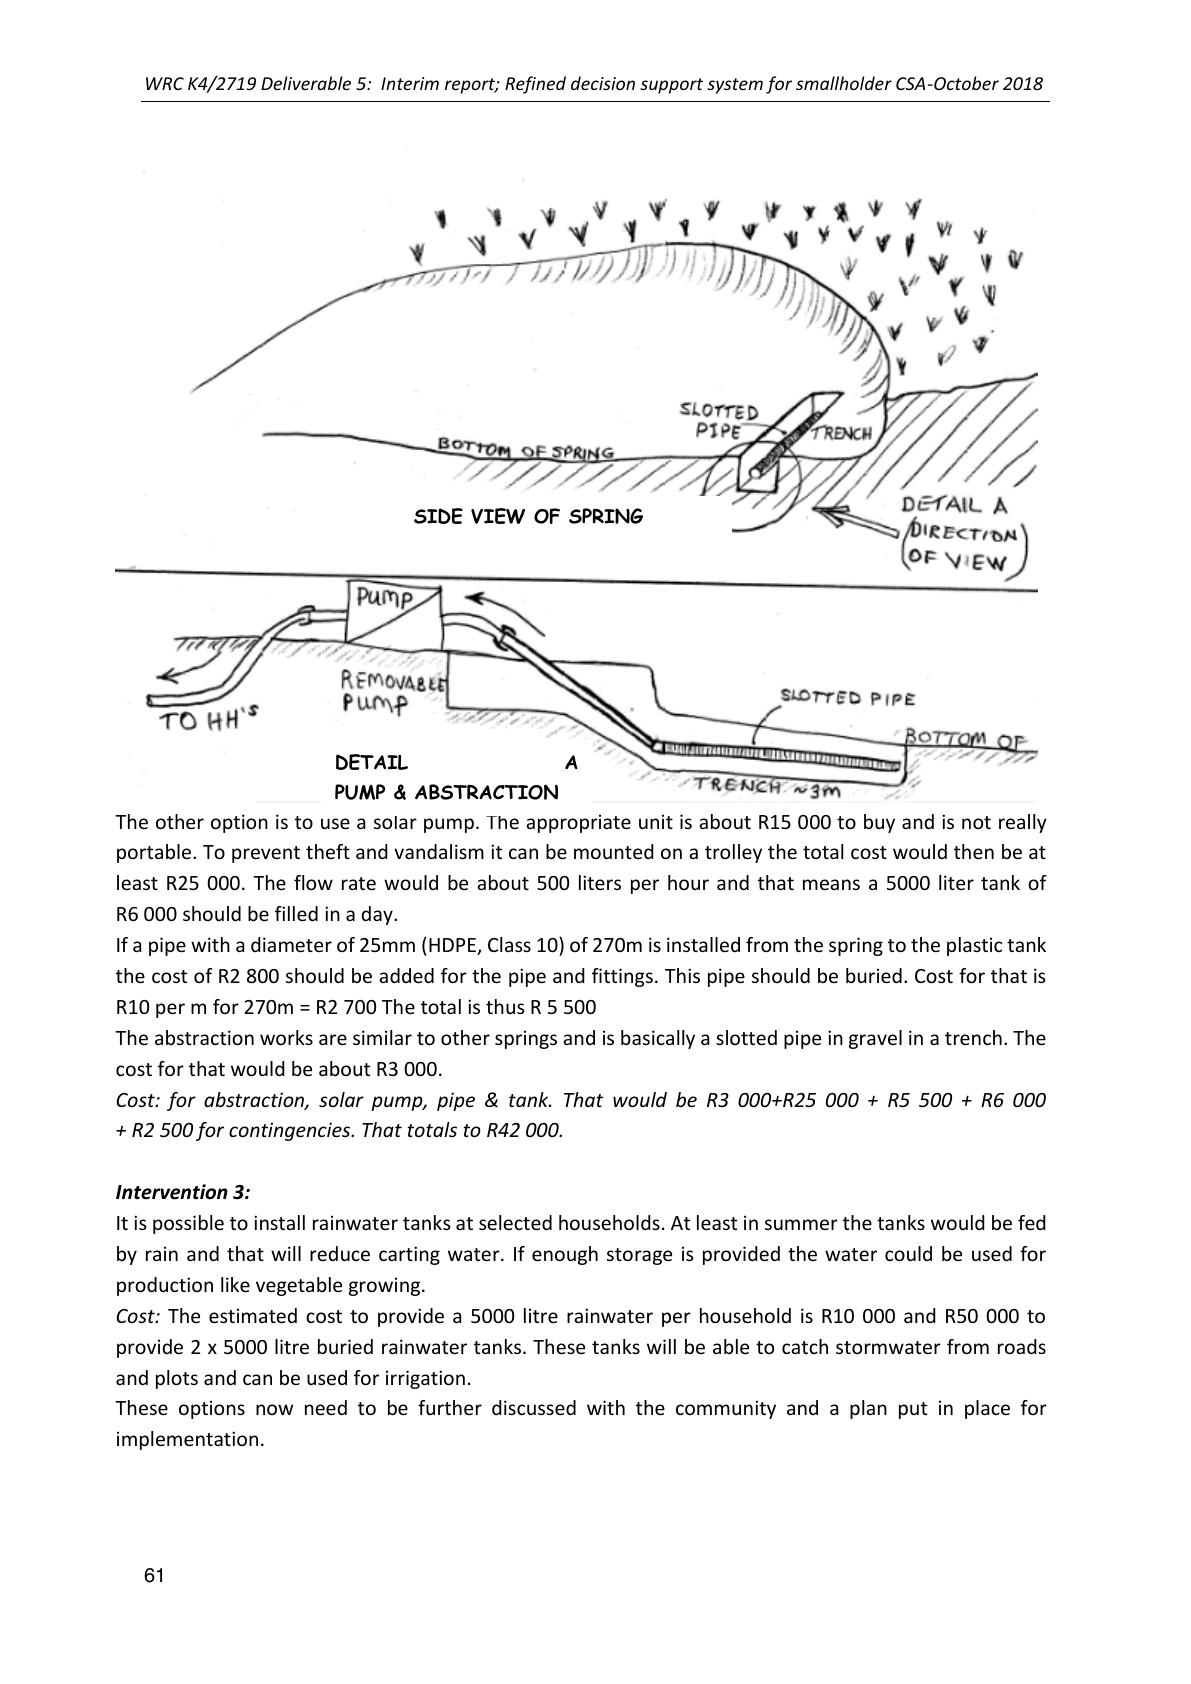
WRC K4/2719 Deliverable 5: Interim report; Refined decision support system for smallholder CSA-October 2018
61
The other option is to use a solar pump. The appropriate unit is about R15 000 to buy and is not really
portable. To prevent theft and vandalism it can be mounted on a trolley the total cost would then be at
least R25 000. The flow rate would be about 500 liters per hour and that means a 5000 liter tank of
R6 000 should be filled in a day.
If a pipe with a diameter of 25mm (HDPE, Class 10) of 270m is installed from the spring to the plastic tank
the cost of R2 800 should be added for the pipe and fittings. This pipe should be buried.Cost for that is
R10 per m for 270m = R2 700 The total is thus R 5 500
The abstraction works are similar to other springs and is basically a slotted pipe in gravel in a trench. The
cost for that would be about R3 000.
Cost:for abstraction,solar pump, pipe & tank. That would be R3 000+R25 000 + R5 500 + R6 000
+ R2 500 for contingencies. That totals to R42 000.
Intervention 3:
It is possible to install rainwater tanks at selected households. At least in summer the tanks would be fed
by rain and that will reduce carting water. If enough storage is provided the water could be used for
production like vegetable growing.
Cost: The estimated cost to provide a 5000 litre rainwater per household is R10 000 and R50 000 to
provide2 x 5000 litre buried rainwater tanks. These tanks will be able to catch stormwater from roads
and plots and can be used for irrigation.
These options now need to be further discussed with the community and a plan put in place for
implementation.
DETAIL A
PUMP & ABSTRACTION
SIDE VIEW OF SPRING
WRC K4/2719 Deliverable 5: Interim report; Refined decision support system for smallholder CSA-October 2018
62
4CSA PRACTICES / DECISION SUPPORT SYSTEM
Written By Catherine van den Hoof1and Erna Kruger
1Post- doctoral fellow at the global change research and sustainability Institute, WITS.
Dr van den Hoof has assisted us in framing the decision support system and developing a model for
this process, as the first step towards designing the web- based platform for this process.
Below the updated processand the model building section of her latest report is presented. This is the
first round of modelling, which will now be followed by trouble shooting, addition of more information
to further test the model and then fine tuning of the model.
Development of DSS
The development of a DSS requires the identification of a range of technical and social criteria relevant
to thecontext, which decision-makersneed to analyse in order to reach their decisions. In our case
the set of criteria that helped tomake informed decisions on management practices were the current
farming systems,the physical environmental conditions, whichlimit the productivityof the framing
systems, and the socio-economic background of the farmer, that together with the farming system
and the environmental conditions can limit the capacity of the farmer to adoptspecific practices. Each
of these above-mentionedfactors need to be translated into proxies that can be used as indicators
for those complex realities. Besides this, the resources and related management strategies as well as
a list of practices need to be provided as input to the system.
All information, except the physical environment; i.e. climate, soil and topography, and the resources
and management strategies, were derived through the use of a range of Participatory Rural Appraisal
(PRA). The practices were identified by both farmers and experts. Data on the physical environmental
conditions are by default taken from datasets freely available online. This information can however
be customised by the DSS user, in case more appropriate informationis available for the specific
farmer concerned.
Conceptual framework
The input data, the flow of processes and the outputs of the DSS are represented in Figure 1. In a first
step the resources to manage and the related strategies are identified based on the physical
environment and the farming systems. Based on these, a range of practices are suggested. The socio-
economic background of the farmer, as well as thefarming system andthe physical environment, tend
to restrict those suggested practices to a more confined number. In the next step, this confined list of
practices is presented to the farmer. Based onits own priorities, capacities and knowledge, the farmer
ranks those practices. The aim is for the farmers themselves to be able todecide on the practices in
which they are more interested, according to their own context and needs. In parallel tothis, the same
confined list of relevant practices is presented to a facilitator. He/she is asked to rank according to its
own opinion on the amplitude of the positive impact of each practice on the resources to manage as
well as on the natural environment as a whole and the ecosystem services that it provides. Both
outputs, relevant practices ranked based on facilitator and relevant practices ranked based on farmer
input, lay the ground for discussion on the options available to farmers to sustain and improve farm

WRC K4/2719 Deliverable 5: Interim report; Refined decision support system for smallholder CSA-October 2018
63
productivity, based on their own aspirations, but also those options seen as more appropriate based
on facilitator’s experience/knowledge regarding not only the resources to manage but also regarding
the natural environment as a whole. The differences between both outputs will also highlight the
relevant practices that might need internal or external support for adoption and implementationby
farmer.
In the context of climate change, the DSS can provide information on management practices that can
be consideredappropriate for increasing resilience. Therefore, future projections are neededas
climate input in the DSS.
Figure 1: Schematic of the Decision Support System (DSS), with model inputs highlighted in grey.
DSS inputs
Physical environment
In the DSS, the components of the physical environment; i.e. climate, topography and soil are each
representedby the following proxies; Agro-Ecological Zones (AEZ), slope gradient and soil texture class
andorganic carbon content, as represented in Figure2. Each componentand related proxy are
described in more details in the following sections.
Figure 2: Components, proxies and sub-categories of the physical environment.
FARMING SYSTEMFARMER SOCIO-ECONOMIC
BACKGROUND
RESOURCES TO MANAGE
SUGGESTED PRACTICES
CONSTRAINED BY
TYPOLOGY, SYSTEM
AND ENVIRONMENT
RANKED PRACTICES
BASED ON FACILITATORRANKED PRACTICES
BASED ON FARMER
FARMER BASED
PRIORITIES
FACILITATOR
BASED PRIORITIES
PHYSICAL ENVIRONMENT
DSS PROCESS FLOW

WRC K4/2719 Deliverable 5: Interim report; Refined decision support system for smallholder CSA-October 2018
64
Climate
Precipitation and temperature, through evapotranspiration,defines largely the moisture availability.
Very high temperatures can cause heat stress to crops and livestock. Crop and livestock diseases and
pests are also often related to temperature and humidity. Climate, in particular precipitation, pattern
has also an impact on soil health and fertility through soil erosion, weathering, leaching, crust
formation etc. Climate also affects weed growth, whichcan strongly reduce harvest. Many crops will
fail almost completely when no weeding is done andlabour requirement for weeding is often the
factor which limits the cropping area. In many sub-humid areas, the control of weeds, particularly
grass weeds, is the most difficult of the farmers' tasks. Climate consists of a variety of variables and
can constrain farming productivity in many ways. Climate constraints are often classified according to
the length of periods with temperatures and moisture limitations. Temperature constraints are
related to the length of the temperaturegrowing period, i.e. the number of days with a mean daily
temperature above 5 °C. For example, a temperature growing period shorter than 120 days is
considered a severe constraint, while a period shorter than 180 days is considered to pose moderate
constraints to crop production. Hyper-arid and arid moisture regimes are considered severe
constraints, and dry semi-arid moisture regimes are considered moderate constraints. For example,
tropics semiarid –warm climate presents unreliable rainfall, together with its warm climate and high
solar radiation levels, creates problems of moisture availability for crops. These climates tend to have
hot, sometimes extremely hot, summers and warm to cool winters, with some to minimal
precipitation. Hence, more efficient water management systems are needed to sustain productivity.
The low rainfall and the long dry season make the semi-arid zone a relatively healthy environment for
man and his livestock.Subtropics semiarid –coolusually featurewarm to hot dry summers, though
their summers are typically not quite as hot as those of hot semi-arid climates. Unlike hot semi-arid
climates, areas with cold semi-arid climates tend to have cold winters. The cold semi-arid climate is
often located at a higher elevation than the hot semi-arid climates. The cold semi-arid climates are
also likely to experience temperature variations between day and night, which is not the case in hot
semi-arid regions.
Currently in the DSS, the climate is defined based on the Agro-Ecological Zones for Africa South of the
Sahara(Sebastian, 2014; HarvestChoice, 2011). Agroecological zones are geographical areas sharing
similar climate characteristics (e.g., rainfall and temperature) with respect to their potential to support
(usually rainfed) farming.Becauseof the generalsimilarityof production conditions, many agricultural
technologies, practices and production systems tend to behave or respond consistently within a
specific AEZ. Agro-Ecological Zones for Africa south of the Sahara were developed based on the
methodology developed by FAO and IIASA. The dataset includes three classification schemes: 5, 8, and
16 classes, referred to as the AEZ5, AEZ8, and AEZ16, respectively. AEZ 5, 8, and 16 classes are based
on the high-resolution agro-ecological data at 10 km resolution. The data can be accessed freely at
doi:10.7910/DVN/M7XIUB. In this study the 16 classes dataset was used, as represented in Table 1.
Subtropics
Tropics
warm
cool
warm
cool
Arid
Semi-arid
Alice/King
William
Tzaneen
Sub-humid
Bergville,
Estcourt

WRC K4/2719 Deliverable 5: Interim report; Refined decision support system for smallholder CSA-October 2018
65
Humid
Table 1: Agro-Ecological Zones encountered in South-Africa (grey) and location of the closest town of
the study sites within these zones.
The different terms in Table 1 are defined as follows:
•Tropics: mean monthly temperature adjusted to sea-level[1] greater than 18ºC for ALL months
•Sub-tropics: mean monthly temperatureadjusted to sea-level less than 18ºC for 1or more
months
•Arid: less than 70 days length of growing period (LGP)
•Semi-arid: 70-180 days LGP
•Sub-humid: 180-270 days LGP
•Humid: over 270 days LGP
•Warm: Zones with mean temperatures greater than 20ºC
•Cool: Zones with mean daily temperatures of 5-20ºC during the growing period
The length of growing period (LGP) is defined as the period during the year when average
temperatures are greater than or equal to 5ºC (Tmean >= 5ºC) and precipitation plus moisture stored in
the soil exceed half the potential evapotranspiration (P > 0.5PET). A normal growing period is defined
as one when there is an excess of precipitation over PET(i.e. a humid period). Such a period meets the
full evapotranspiration demands of crops and replenishes the moisture definite of the soil profile. An
intermediategrowing period is defined as one in which precipitation does not normally exceed PET
but does for part of the year. No growing period is when temperatures are not conducive to crop
growth or P never exceeds PET (FAO 1978).
South Africa covers 12 different AEZ. Theseare highlighted in grey In Table 1. The sites currently
covered in this study are located in three of these 12 AEZs: i.e. tropics semi-arid –warm, sub-tropics
semi-arid –warm and subtropics sub-humid –cool. Those are also represented in Table 1. Semi-arid
regions in South Africa are characterised by mean annual precipitation between 200mm and 400mm,
and the sub-humid regions by mean precipitation between 400mm and 1100mm.
The geographicaldistribution of these AEZ have been delineated based on the averageclimate
between 1961 and 1990, using the data from the Climate Research Unit (CRU) at the University of East
Anglia and the data from VASClimO (Variability Analysis of Surface Climate Observations), a joint
climate research project of the German Weather Service(Global Precipitation Climatology Centre ‐
GPCC) and the JohannWolfgang Goethe‐University Frankfurt (Institute for Atmosphere and
Environment ‐ Working Group for Climatology). The data can be accessed from the
http://gaez.fao.org/ website.
Concerning future climate projections, various available climate predictions of General Circulation
Models (GCM) were used for characterization of future climates. The geographical distribution of the
AEZ under future projections are based on four major GCMs and cover a range of IPCC emission
scenarios. GCM model outputs for individual climate attributes were applied as follows: deviations of
the monthly means of three 30-year periods (the 2020s: years2011-2040; the 2050s: years 2041-2070;
and the 2080s: years 2071-2100) from the GCM ‘baseline’ climate were calculated for each grid of the

WRC K4/2719 Deliverable 5: Interim report; Refined decision support system for smallholder CSA-October 2018
66
respective GCMs, interpolated to 30 arc-minute resolution and subsequently applied to the CRU
baseline climatology (1961-1990) to represent respective future climates.
Most scenarios for southern Africa suggest increasing temperatures, and associated increases in
evapotranspiration, with less certainty over changes in precipitation (IPCC 2007; Cooper et al. 2008;
Bryan et al. 2013). Rainfall is generally expected to become more erratic, with delayed onsets, with
increases in both inter-and intra-seasonal droughts, and with more frequent and intense flood events
(Cooper et al. 2008; Twomlow et al. 2008;IPCC, 2014). Climate change will amplify existing stress on
water availability and on agricultural systems, particularly in semi-arid environments (IPCC, 2014).
Given those projected increases in variability, it is suggested not only to account for change in mean
but also in interannual variability; increasingvariability and unpredictability will increase the
vulnerability of the farmers to climate.
Soil
Soil texture and organic mattercontent are important soil characteristics that influence water quantity
and soil fertility and health.Soil organic matter affectsthe chemical and physical properties of the soil
and its overall health by providing nutrients and habitat to organisms living in the soil, its composition
and breakdown rate,which affectthe soil structure and porosity,the water infiltration rate and
moisture holding capacity of soils; the diversity and biological activity of soil organisms; and plant
nutrient availability. It reduces compaction and surface crusting and facilitates rooting. The same can
be stated for the soil texture.
Based on various proportions of sand, silt, and clay, the soils can be categorizedas one of the four
major textural classes: sands, silts, loams, and clays (Berry et al. 2007). Sandy soils are referred to as
coarse-textured and have the tendency to drain quickly after rainfall or irrigation. Because they drain
faster than other soil textures, they are subject to nutrient losses through leaching, and they also
warm faster in the spring. Sandy soils tend to have a low pH and very little buffering capacity; hence,
are often acidic. Silty soils might be fairly well-drained, but they usually retain more water than sandy
soils. These soils have the tendency to compact easily when moist and form crusts when wet. The
clayey soils,which are fine-textured soils tend to drain waterslowly, can easily be compacted if
trampled while wet, and harden when dry. Because of their tendency to hold more water and drain
slowly, fine-textured soils also warm up slowly during the spring. Loamy soils have relatively even
percentages of sand, silt, and clay separates. Loams are slightly gritty, relatively well-drained, and easy
to work with agricultural tools. Loams usually hold water well and drain easily.
The four texture classes have been defined based on theclay silt and sand fraction taken from the
AfSoilGrids 250m soil database (Hengl et al., 2017), and grouped according to the texturalclasses
represented in Figure 3, and further regrouped as follows:
-Sandy soils: sand, loamy sand,
-Silty soils: silt,
-Clayey soils: clay, sandy clay and silty clay,
-Loamy soils: silty clay loam, clay loam, loam, silty loam, sandy clay loam, sandy loam.

WRC K4/2719 Deliverable 5: Interim report; Refined decision support system for smallholder CSA-October 2018
67
Figure 3: Soil texture triangle.
Soils with higher levels of fine silt and clay usually havehigher levels of organic matter thanthose with
a sandier texture. Currently in our DSS, soil fertility is defined based on the percentage in soil organic
carbon content, taken from the AfSoilGrids 250m soil database (Hengl etal., 2017). In south Africa,
about 58% of soils contain less than 0.5% organic carbon and only 4% contain more than 2% organic
carbon(du Preez et al., 2011). Based on this information, three different categories have been created
as follows: (1) <0.5%, (2) 0.5% - 2% and (3) >2%.
TheAfSoilGrids 250m dataset (Hengl et al., 2017)contains the following soils characteristics for the
whole African continent at 250 m spatial resolution at seven standard soil depths (0, 5, 15, 30, 60, 100
and 200 cm).
•soil organic carbon (gC/kg)
•pH (in H2O)
•fraction of sand (kg/kg)
•fraction of silt (kg/kg) and clay (kg/kg)
•bulk density (kg/m3)
•cation-exchange capacity (CEC, cmol +/kg)
•depth to bedrock (cm)
•probability of occurrence of R horizon or bedrock within 200cm
•soil classes based on the World Reference Base (WRB) and the United States Department of
Agriculture (USDA) classification systems

WRC K4/2719 Deliverable 5: Interim report; Refined decision support system for smallholder CSA-October 2018
68
This dataset can be found at https://www.isric.online/projects/soil-property-maps-africa-250-m-
resolution. In case soil texture has been measured locally, this observation can be used as input for
the DSS instead of the values taken from the above mentioned AfSoilGrids 250m dataset. The same is
valid concerning the soil organic matter content.In the future, additional soil characteristics, from the
database or observed, could be used as input for theDSSto better definesoil structure, water holding
capacity, health and fertility, etc.
Topography
Topography, and in particular the slope grade, enhance erosion and run-off, and by consequence
reduces soil fertility and water infiltration. Around up to5% slope, the conditions for agricultural
production are optimal. Between 5 and 15% the conditions are sub-optimal and beyond 15% they are
on average not suitable. The slope gradients have therefore beendivided in 3 classes: flat to gently
sloping (<5%), undulating to rolling (5%-15%) and hilly to very steep land (>15%).
Slope gradient data at around 1km resolution have been made available at the http://gaez.fao.org/
website. These data have been compiled using elevation data from the Shuttle Radar Topography
Mission (SRTM). The SRTM data is publicly available at around 100 meters resolution at the equator.
However, in case topographic information hasbeen observed locally, those values can be used as
input for the DSS instead of the values taken from the above-mentioned database.
Farming systems
The vast majority of South Africa’s rural residents derive their livelihoods from a number of diverse
on-farm and off-farm sources. The on-farm sources can be divided as follow: crops, livestock and
other natural resources. Crops have been divided in field cropping and vegetable gardening, since the
management practices differ strongly between both, in particular due to differences in plot size and
location; gardens are smaller and generallycloser to the house. Vegetable gardening is also oftena
dry-seasonactivity. The extent of this activityis then largely influenced by availability of a reliable
water source. By consequence the DSS differentiates the following farming systems:
•Vegetable gardening
•Field cropping
•Livestock
•Trees and other natural resources
Information on the farming systems has been collected during the field work. It has to be mentioned
that a farmer can belong to more than one farming system type.
Farmer socio-economic background
Extensive socio-economic and demographic background information from the different farming
household (HH) involved in this study has been compiled during the field work. The different themes
are listed below:
•Demographic information
oGender HH head
WRC K4/2719 Deliverable 5: Interim report; Refined decision support system for smallholder CSA-October 2018
69
oAge HH head
oDependency ratio HH head
•Learning and access to education (level of education)
•Source of income (unemployment vs. external employment, own business, grants, farm, etc.)
•Total income
•Access to services, infrastructure, technology
oElectricity
oWater (tap, borehole, rainwater harvesting, etc.)
oIrrigation (buckets, standpipes, etc.)
oFencing
oFarming tools (hand vs traction/other)
•Social organisation (saving clubs, cooperatives, others)
•Market access (formal vs. informal)
•Farm size
•Farming purpose (food vs. selling)
Based on their vulnerability to shocks and stress, the farming households have been subdivided into
three categories. The most vulnerable have been assigned to typology A and the less vulnerable to
typology C. Farmer typology is a way of segmentingfarmersinto groups to assist in developing
targeted farm extension programs. Both typologies A and B can be considered to have a high level of
vulnerability, but A is more extreme. Typology C indicates a much smaller group of smallholder farmers
who have better or more reliable access to infrastructure and support, are generally better educated,
have access to larger fields and more livestock and farm primarily for income generation purposes.
They fund these farming enterprises primarily through incomes earned from employed members
within the household, or a combination of employment and social grants (including pensions). These
farmers are also more likely to belong to cooperatives and farmers associations and to have access to
formal market linkages.
From this, we can state that the typology of a farming HH can be differentiate by the HH head gender,
dependency ratio (ratio of children and pensioners against working aged adults within HH), level of
education, employmentstatus, income, access to services and formal market, farming purpose and
farm size. The different options of outcome for those 9 socio-economic and demographic
characteristicsare provided in Table 2,as well as to which typologythey belong. An outcome can
belong to different typology; for example, typology A as well as typology B are often characterised by
a female headed farming HH.
In the DSS, the typology with the most frequent outcome is assigned as mean typology to the farming
HH. In case two typologies are equally frequent, the typology with the lowest level is assigned to the
HH. This HH typology is further used as proxy for the socio-economic background of the HH. An
example of how a specific typology is assigned to a farming HH is provided below and is based on the
information provided in Table 2.
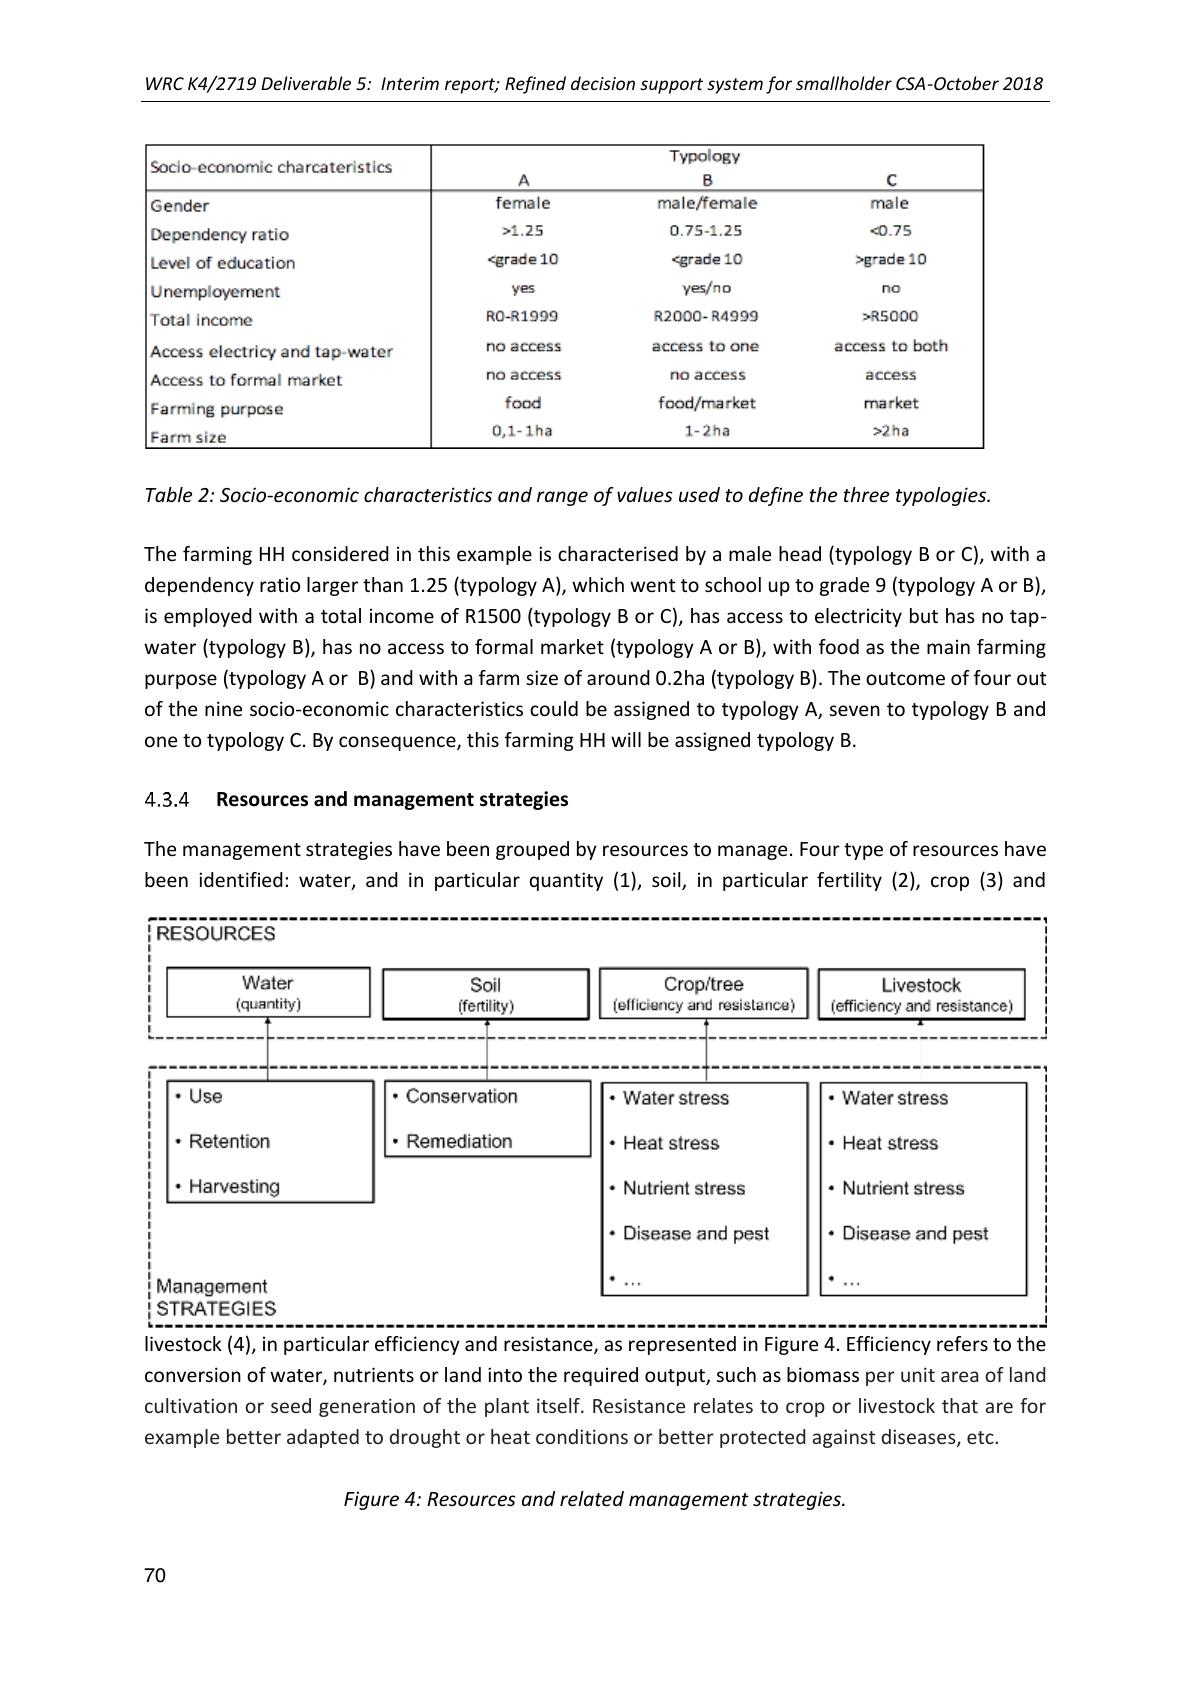
WRC K4/2719 Deliverable 5: Interim report; Refined decision support system for smallholder CSA-October 2018
70
Table 2: Socio-economic characteristics and range of values used to define the three typologies.
The farming HH considered in this example is characterised by a male head (typology B or C), with a
dependency ratio larger than 1.25 (typology A), which went to school up to grade 9 (typology A or B),
is employed with a total income of R1500 (typology B or C), has access to electricity but has no tap-
water (typology B), has no access to formal market (typology A or B), with food as the main farming
purpose (typology A or B) and with a farm size of around 0.2ha (typology B). The outcome of four out
of the nine socio-economic characteristics could be assigned totypology A, seven to typology B and
one to typology C. By consequence, this farming HH will be assigned typology B.
Resources and management strategies
The management strategies have been grouped by resources to manage. Four type of resources have
been identified: water, and in particular quantity (1), soil, inparticular fertility (2), crop (3) and
livestock (4), in particular efficiency and resistance, as represented in Figure 4. Efficiency refers to the
conversion of water, nutrients or land into the required output, such as biomass per unit area of land
cultivation or seed generation of the plant itself. Resistance relates to crop or livestock that are for
example better adapted to drought or heat conditions or better protected against diseases, etc.
Figure 4: Resources and related management strategies.

WRC K4/2719 Deliverable 5: Interim report; Refined decision support system for smallholder CSA-October 2018
71
Agricultural practices
Based on farmers and expert knowledge, a list of relevant practices has been set up, including, in case
of available information,their beneficial impacton the different resources mentioned in section 3.2.4,
the required tools, financial investment and knowledge as well as the limitationsset by the physical
environment to implement these practices. This list of practices, that can be found in Appendix A, is
not exhaustive and can be extended with other practices. All suggested practices are assumed to fit
within at least one of the three CSA principles, which are 1) increasing productivity, (2), increasing
resilience to climate change, (3) reducing contribution to climate change.
DSS processes and intermediate steps
Defining resources to manage based on physical environment and farming systems
As introduced in section 3.2.1., the resources to manage and the related strategies depend strongly
on the physical environment; i.e. climate, soil and topography, and the combinationof those three
components. For example, in sub-humidenvironments, biotic factors, such as the amount of
vegetation and organic matter, as well as the soil texture play a significant role in maintaining good
soil status and preventing erosion; high sand content and low clay content increased the likelihood of
erosion. In the semi-arid and arid regions, high levels of sand content also increase the likelihood of
erosion but so do high levels of clay;due to lack of vegetation, there will be a crusting of the clay
surface which increases erosion. Slope grade has also a variable effect on erosion under different
climatic zones, and in particular due to differences in amount of rainfall;severely eroded soils are
present in the semi-arid zone with slopes greater than 15%, whereas slightly to moderately eroded
soils were found in the sub-humid zone under the same slope classes.
The information provided in this section as well as in section 3.2.1 has been compiled and used to
build Table 3. The justification for managing the different resources in our DSS is as follows:
•Semi-arid warm: in this environment water is limited and the temperatures can be hot.
•Sub-humid cool: in a more humid environment, weeds are growing well and can create a
competing environment for nutrients. Plants and animals are also more prone to diseases.
•Sandy soils: those soils have poor structures, with low water and nutrient holding capacity.
They heat up fast.
•Clayey soils: high level of clay can increase the probability of erosion due to crusting, in
particular under a semi-arid environment.
•OC: soils with less than 2% OC are considered to be of low fertility.
•Sloping: above 5% sloping, agricultural production becomes sub-optimal due to erosion and
run-off, in particular in semi-arid regions. Sloping above 15%, agricultural production is not
suitable under all conditions, due to water and nutrient run-off.
Table 3 allows to identify, for each farming HH, theresources to manage and the related strategies
provided the farming system and the environmental conditions.

WRC K4/2719 Deliverable 5: Interim report; Refined decision support system for smallholder CSA-October 2018
72
Table 3: Criteria for defining the resources to manage and related strategies, based on the physical
environment and farming system (grey boxes) (*: solely if semiarid zone).
A farming HH is defined by one of the options within each component of the physical environmental
categories (see Figure 2); i.e. AEZ, soil textures, OC and slope. If one of these options vs. resources and
management strategies box in Table 3 is highlighted in grey, it suggests that the specific resource
needs tobe managed by mean of the provided strategy but solely if the farming system, atthe bottom
of this Table 3, suggests to do so (if those boxes are highlighted in grey as well). In case of field
cropping, vegetable gardening and others such as trees, the resources tomanage are restricted to
water quantity, soil fertility and crop, while for livestock farming system, it is restricted to livestock,
water quantity and soil fertility. The boxes highlighted with an asterisk (*) suggest a conditional
criterion; i.e. farming on a clayey soil only need soil conservation if it is located in a semi-arid region.
For example, a farming HH in Tzaneen (tropic semi-arid warm climate according to Table 1), which
main farming systems are crop fieldand gardening on sandy soils with less than 0.5% soil organic
carbon (OC) and located in an undulatinglandscape (slope between 5% and 15%), wouldneed,
according to Table 3, to manage the water quantity through water harvesting, increasingwater use
efficiency and retention as well as increase the resistance to drought and the water use efficiency of
crops and vegetable, to conserve and improve soil fertility, toincrease the heat resistance of
crop/vegetable and the efficiency of nutrient uptake by the crop/vegetable.
Suggesting management practices based on resources to manage
Based on the information provided in section 3.2.5 and Appendix A, Table 4 has been built. This Table
4 associates the practices to the resources and the management strategies that they cover. It can be
seen that a practice can be beneficial to different resources through different mechanisms and
strategies. This Table 4 allows to select the practicesthat could be used to manage the resources,
through specific strategies, that were identified in section 3.3.1.

WRC K4/2719 Deliverable 5: Interim report; Refined decision support system for smallholder CSA-October 2018
73
Table 4: Criteria for selecting practices based on the resources to manage and related strategies (grey
boxes).

WRC K4/2719 Deliverable 5: Interim report; Refined decision support system for smallholder CSA-October 2018
74
Confining suggested practice based on restrictions set by the farmer’s socio-economic
background, the farming system and the environmental conditions
Practices that have been suggested in section 3.3.2 to manage specific resources might not be
appropriate under specificenvironmental conditions, farming systems and socio-economic
conditions. Environmental conditions such as steep slopes, too hard or too soft soils, too much or not
enough rain might limit the implementation of certain practices. Farming systems might also restrict
the choice of practices; for example, practices that require a significant area or mechanisation, are
solely appropriate to fields, since they are much larger than gardens. Finally, farmer socio-economic
background also limits the implementation of certain practices; for example, practices that are labour
intensive, costly, requiring significant mechanisation,input or skills, might not be appropriate for
farmers of typology A or B. Farmer typology, as defined in section 3.2.3, has been proven to be a good
indicator for the adoption or not of a practiceby a farmer. Those restrictions for practice
implementationdue to physical environment, farming system or farmer’s typology are represented in
Table 5, which has been built based on the information provided in Appendix A.
This Table 5 highlights in greythe suitabilityof the practicesunder the different physical
environmental conditions, farming systems and farmer’s socio-economic background. In case the
practice in not suitable for one of these categories or sub-categories characterising the farming HH,
the practice is rejected from the list of suggested practices.

WRC K4/2719 Deliverable 5: Interim report; Refined decision support system for smallholder CSA-October 2018
75
Table 5: Criteria for confining the selected practices based on farmer’s typology, physical environment
and farming system (grey boxes).

WRC K4/2719 Deliverable 5: Interim report; Refined decision support system for smallholder CSA-October 2018
76
Ranking relevant practices based on farmer and facilitator input
Ranking based on facilitator input
The facilitators are asked to assign per resource for each practice a value between 0 and 3, according
to what the facilitator think to be the level of beneficial impact, direct or indirect, of the practice to
improve or sustain the specific resource, with 0 as no beneficial impact, 1 as low, 2 as medium and 3
as high beneficial impact on the specific resource. Besides the impact on the four resources mentioned
earlier; i.e. water, soil, crop and livestock, a score has to be assigned to the beneficial impact of the
practice on the natural environment with regard to the ecosystem services it provides. An example of
scores given by a facilitator of Mahlathini Development Foundation is shown in Table 6.
The relevant practices that were selected in section 3.3.3 based on the physical environment, the
farmer system and typology are ranked by summing the different scores assigned to each practice for
the five different resources. The practices with the highest total score are assumed to contribute the
most, based on the facilitatorknowledge/experience, to improve or to sustain the different resources.
A separate ranking can be made for the contribution to the natural resources only.
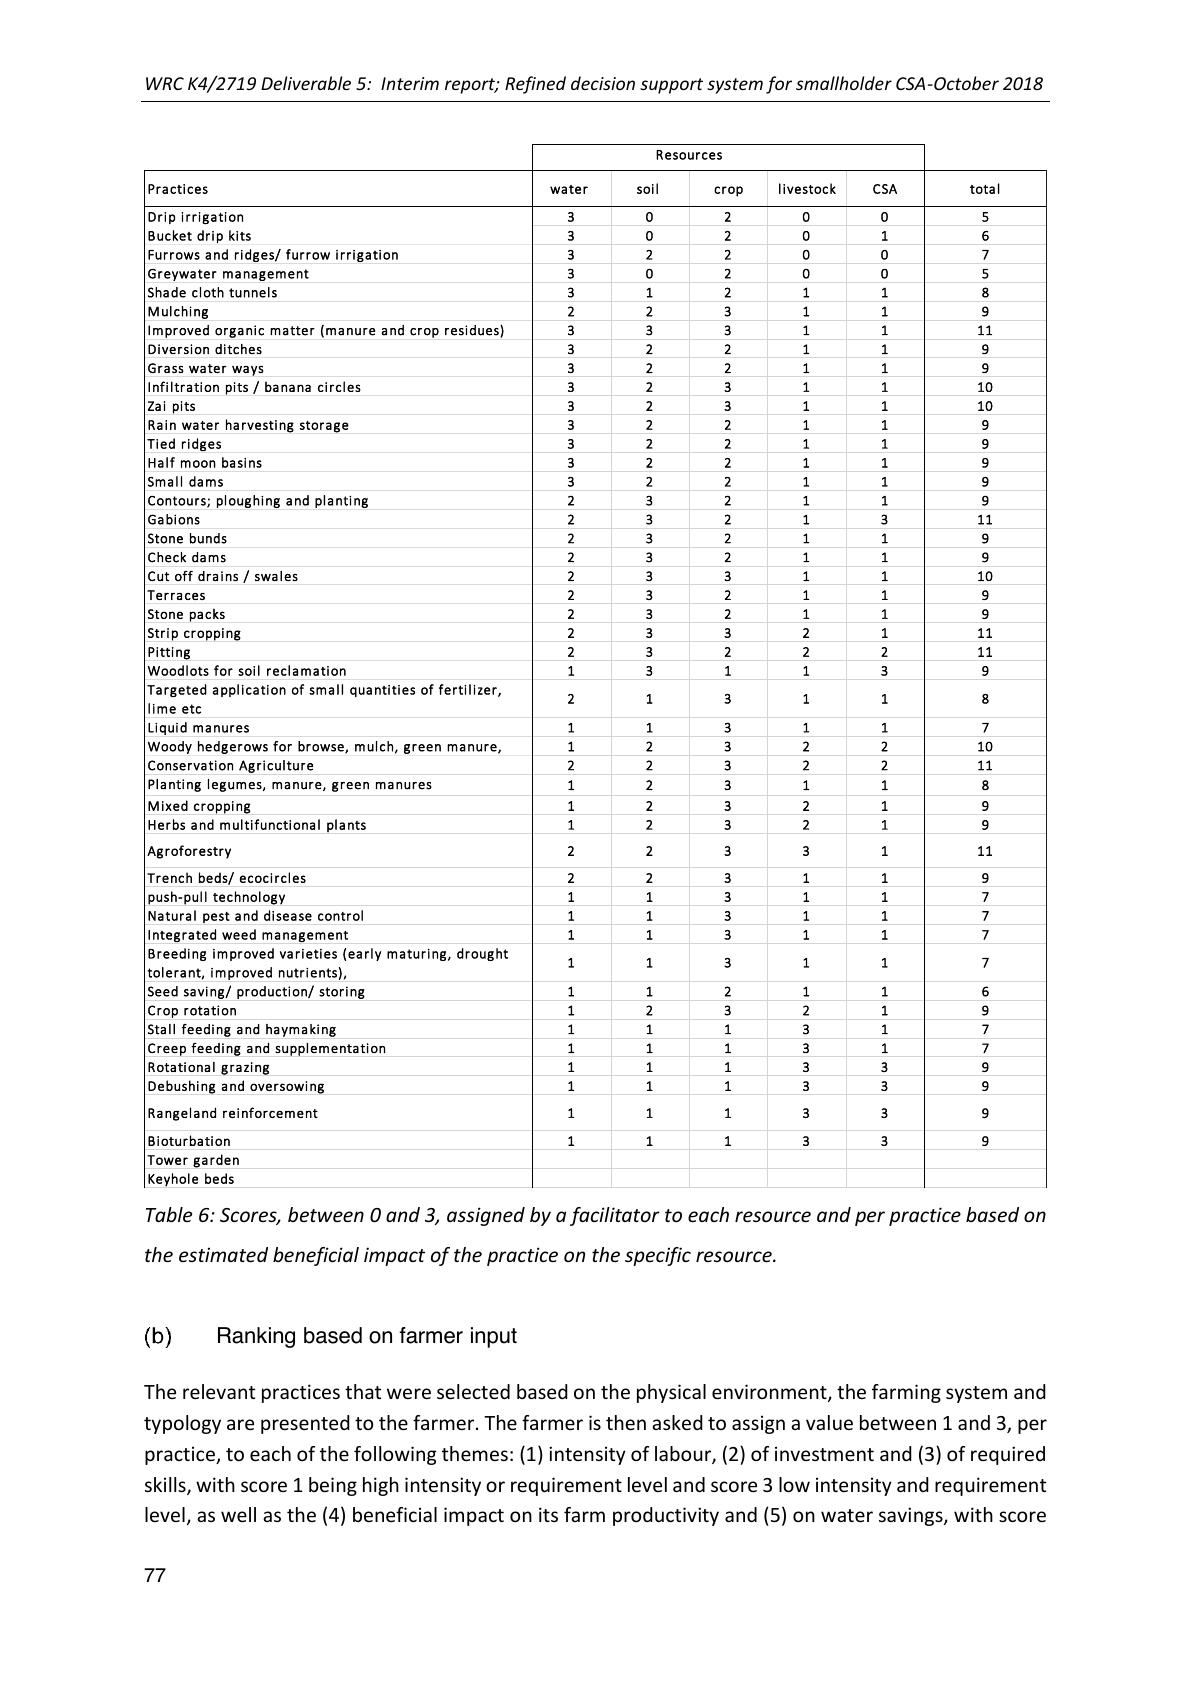
WRC K4/2719 Deliverable 5: Interim report; Refined decision support system for smallholder CSA-October 2018
77
Table 6: Scores, between 0 and 3, assigned by a facilitator to each resource and per practice based on
the estimated beneficial impact of the practice on the specific resource.
Ranking based on farmerinput
The relevant practices that were selected basedon the physical environment, the farming system and
typology are presented to the farmer. The farmer is then askedto assign a value between 1 and 3, per
practice, to each of the following themes: (1) intensity of labour, (2) of investment and (3) of required
skills, with score 1 being high intensity or requirement level and score 3 lowintensity andrequirement
level, as well as the (4) beneficial impact on its farm productivity and (5) on water savings, with score
PracticeswatersoilcroplivestockCSAtotal
Dripirrigation302005
Bucketdripkits302016
Furrowsandridges/furrowirrigation322007
Greywatermanagement302005
Shadeclothtunnels312118
Mulching2 2 3 1 19
Improvedorganicmatter(manureandcropresidues)3331111
Diversionditches322119
Grasswaterways322119
Infiltrationpits/bananacircles3231110
Zaipits3231110
Rainwaterharvestingstorage322119
Tiedridges322119
Halfmoonbasins322119
Smalldams322119
Contours;ploughingandplanting232119
Gabions2 3 2 1 311
Stonebunds232119
Checkdams232119
Cutoffdrains/swales2331110
Terraces2 3 2 1 19
Stonepacks232119
Stripcropping2332111
Pitting2 3 2 2 211
Woodlotsforsoilreclamation131139
Targetedapplicationofsmallquantitiesoffertilizer,
limeetc
2 1 3 1 18
Liquidmanures113117
Woodyhedgerowsforbrowse,mulch,greenmanure,
1 2 3 2 210
ConservationAgriculture2232211
Plantinglegumes,manure,greenmanures1 2 3 1 18
Mixedcropping123219
Herbsandmultifunctionalplants123219
Agroforestry2233111
Trenchbeds/ecocircles223119
push-pulltechnology113117
Naturalpestanddiseasecontrol113117
Integratedweedmanagement113117
Breedingimprovedvarieties(earlymaturing,drought
tolerant,improvednutrients),
1 1 3 1 17
Seedsaving/production/storing112116
Croprotation123219
Stallfeedingandhaymaking111317
Creepfeedingandsupplementation111317
Rotationalgrazing111339
Debushingandoversowing111339
Rangelandreinforcement111339
Bioturbation1 1 1 3 39
Towergarden
Keyholebeds
Resources

WRC K4/2719 Deliverable 5: Interim report; Refined decision support system for smallholder CSA-October 2018
78
1 being no or very low impact and score 3 being high impact. All scores are summed per practice to
get a total score and to allow for the practices to be ranked, according to the farmer’s aspirations and
abilities. The practice with the highest score gets the highest ranking.
Implementation of DSS in Excel
The above-mentioned flow of processes has been implemented as routines and tabulars in Excel in
the file named “DSS_model_v2.xls”. The implementation steps and rules are provided and described
in this section. The DSS_model_v2.xls file consists of 8 work sheets:
•DSS_input
•Typology
•Resources to manage
•Tab pract. vs res.
•Tab pract. vs constrains
•Tab score facilitator
•Tab score farmers
•Example for HH1
“DSS_input” sheet
The input data, as described in section 3.2, has been imported into sheet “DSS_input” for the 26
farming HH. The content of this sheetis provided in Appendix B, where it has been split-up in two
tables; i.e. Table B.1, with the physical environment input data, andTable B.2, with the socio-economic
background and farming system input data.A description of each variable inthose tables are provided
below:
•HH -no. of participant: number, from 1 to 26, assigned to each farming HH interviewed during
the field survey
•Location:
-Name & Surname: name and surname of the HH head of the farming HH.
-Village: name of the village where the farming HH is located.
-Town: closest town to the farming HH.
-Province: province where the farming HH is located.
-Longitude: approximate longitude where the farming HH is located.
-Latitude: approximate latitude where the farming HH is located.
•Climate –AEZ: this is the name of the agro-ecological zone (Sebastian, 2014; HarvestChoice,
2011) where the farming HH is located”, as described in section 3.2.1.1.The GIS file of the AEZ
dataset (Sebastian, 2014; HarvestChoice, 2011), as well as the related legend, are provided in
the compressed folder “input_datasets.zip.
•Soil: information on soil texture and soil organic carbon content, based on the AfSoilGrids
250m soil database (Hengl et al., 2017), as described in section 3.2.1.2. The GIS file of the soil
datasets as well as the related legend, are provided in the compressed folder
“input_datasets.zip”
-Texture adapted: the soil texture can be either sand, clay, loam, silt, and is based on the
AfSoilGrids 250m soil database (Hengl et al., 2017), and the soil texture triangle, as described

WRC K4/2719 Deliverable 5: Interim report; Refined decision support system for smallholder CSA-October 2018
79
in section 3.2.1.2, but adapted, if required, based on the soil samples taken during the field
survey. This column is used as input for the DSS.
-Texture AfSoilGrids: the soil texture can be either sand, clay, loam, silt, and is based on the
AfSoilGrids 250m soil database (Hengl et al., 2017), and the soil texture triangle, as described
in section 3.2.1.2. This column is not used as input in the DSS.
-OC AfSoilGrids: % of soil organic mattertaken from the AfSoilGrids 250m soil database (Hengl
et al., 2017).
•Topography: average slopes of the terrain where the farming HH is located, as described in
section 3.2.1.3. The GIS file of the slope dataset as well as the related legend, is provided in
the compressed folder “input_datasets.zip”
-slope: this column translates thecodes providedin the GIS file into the slope % categories,
as defined in the legend file. These categories are further adapted to the categories used in
this study, as defined in section 3.2.1.3. Since the used categories differ from the dataset
categories, a farming HH may fall in more than one slope category, and a value 1 is assigned
to each of them;
-slope 0-5%
-slope 5-15%
-slope >15%
•Gender HH: the value of 1 means that HH head is a female and a value of 0 a male.
•Dependency ratio: ratio of children and pensioners against working aged adults within HH
•Education: highest level of educationof the HH head, expressed inthe school grade achieved.
A value of 99 means that the HH head has obtained a higher degree than grade 12.
•employment satus: the employment status of the household head is expressed as 1 for
unemployed and 0 for employed.
•Income: total income of the HH, including social grants, employment and sellingof farm
products, etc.
•Access electricity and tap water: a value of 1 in the column “tap water” means that the HH has
access to tap water and a value of 0means there is no access. The sameis valid for the column
“electricity” in the context of access to electricity.
•Market access: a value of 1 represents HH that have access to formal markets while 0 means
that the HH has no access.
•Farming purpose: a value of 1 means that the main purpose of farming is to sell the products
at the market, while a value of 0 means that the main purpose is own consumption.
•Farm size: the total size of the farm fits within one of the following categories; i.e. 0,1-1 ha, 1-
2 ha, >2ha, by assigning the value 1. The other two categories will be assigned the value 0.
•Farming systems: the farming HH belongsto at least one of the following 4 categories; i.e.
gardens, field, livestock/chickens, trees/natural, by assigning the value 1. If the HH does not
practice a specific farming system, the value 0 is assigned to that category.
The source data for the climate (AEZ), soil (texture and organic carbon) and topography (slope), as
mentioned in section 3.2 are provided in the folder zipped “input_datasets”.These datasets are either
georeferenced tifffiles or GIS shapefiles that can be imported as suchin a GIS such as the open source
software QGIS. The related legends are provided as well.
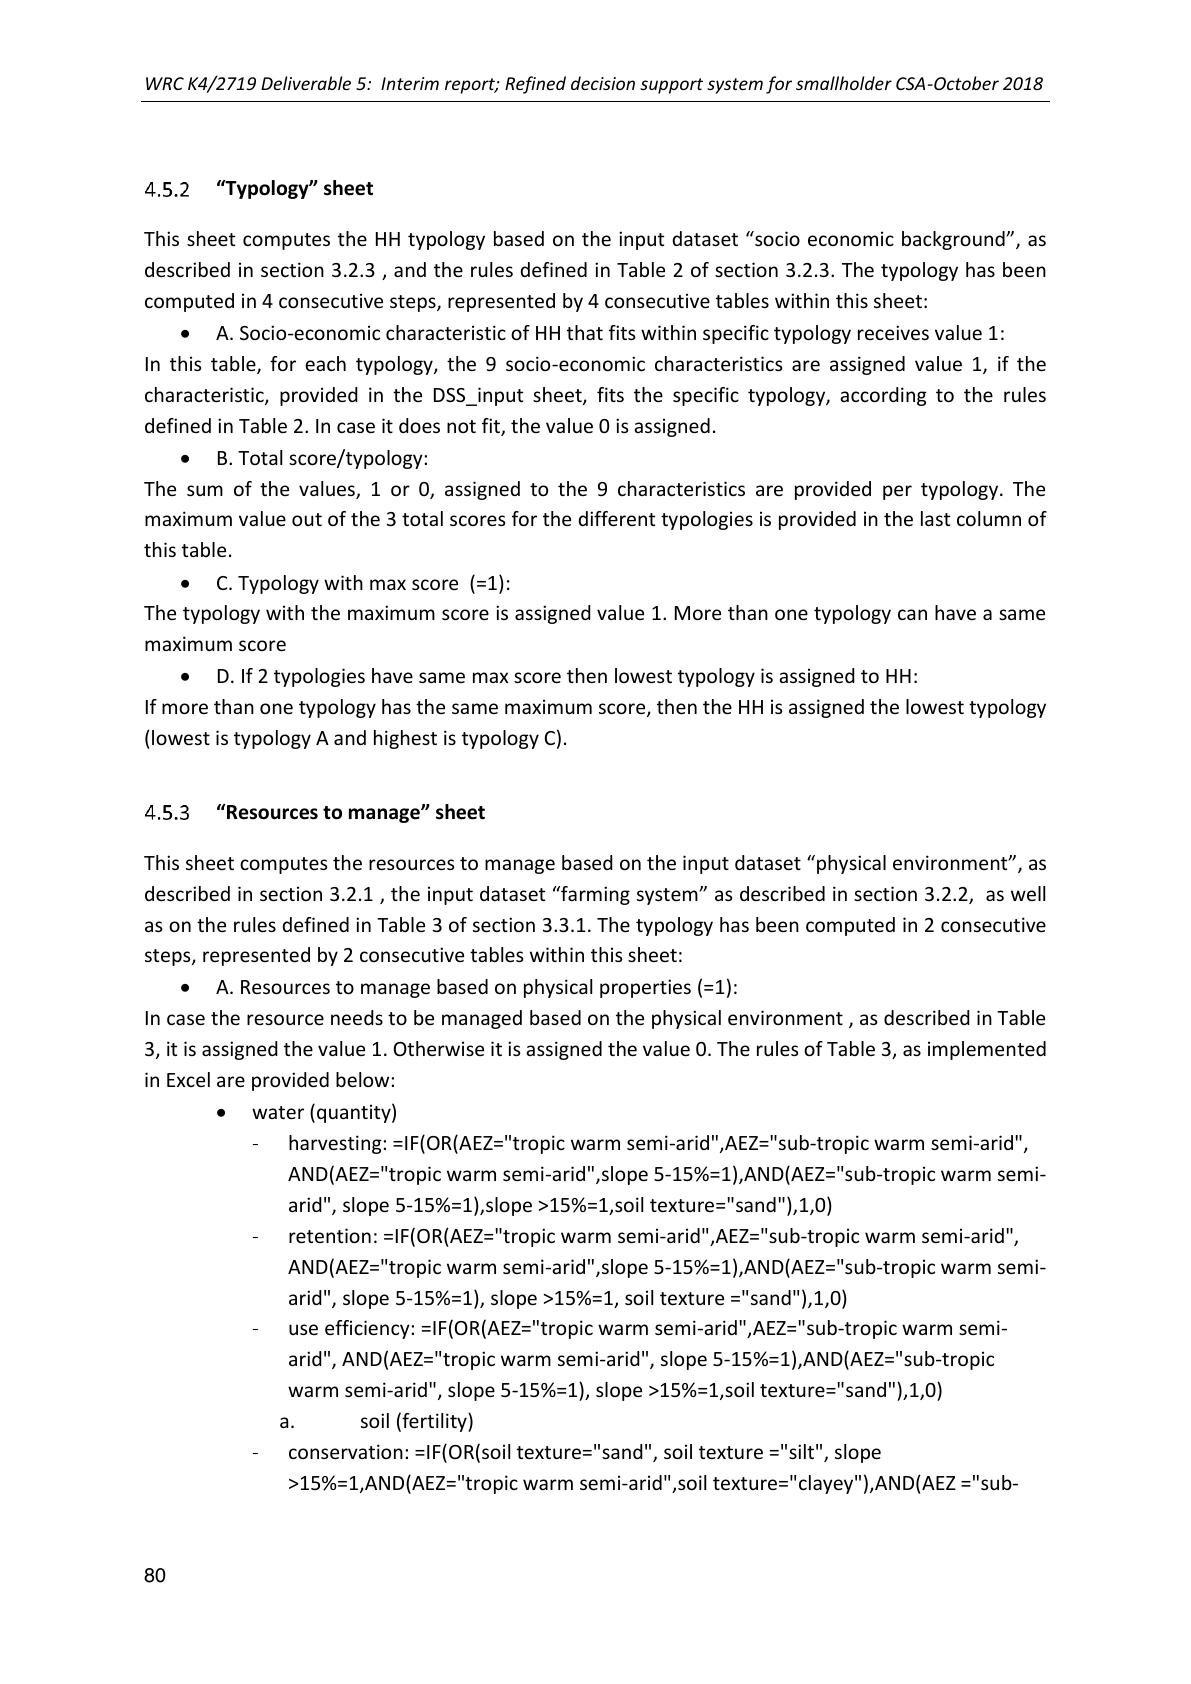
WRC K4/2719 Deliverable 5: Interim report; Refined decision support system for smallholder CSA-October 2018
80
“Typology” sheet
This sheet computes the HH typology based on the input dataset “socio economic background”,as
described in section 3.2.3, and the rules defined in Table 2 of section 3.2.3. The typology has been
computed in 4 consecutive steps, represented by 4 consecutive tables within this sheet:
•A. Socio-economic characteristic of HH that fits within specific typology receives value 1:
In this table, for each typology, the 9 socio-economic characteristicsare assigned value 1, if the
characteristic, provided in the DSS_input sheet, fits the specific typology, according to the rules
defined in Table 2. In case it does not fit, the value 0 is assigned.
•B. Total score/typology:
The sum of the values, 1 or 0, assigned to the 9 characteristics are provided per typology. The
maximum value out of the 3 total scores for the different typologies is provided in the last column of
this table.
•C. Typology with max score (=1):
The typology with the maximum score is assigned value 1. More than one typology can have a same
maximum score
•D. If 2 typologies have same max score then lowest typology is assigned to HH:
If more than one typology has the same maximum score, then the HH is assigned the lowest typology
(lowest is typology A and highest is typology C).
“Resources to manage” sheet
This sheet computes the resources to manage based onthe input dataset “physical environment”, as
described in section 3.2.1, the input dataset “farming system” as described in section 3.2.2, as well
as on the rules defined in Table 3 of section 3.3.1. The typology has been computed in 2 consecutive
steps, represented by 2 consecutive tables within this sheet:
•A. Resources to manage based on physical properties (=1):
In case the resource needs to be managed based on the physical environment , as described in Table
3, it is assigned the value 1. Otherwise it is assigned the value 0. The rules of Table 3, as implemented
in Excel are provided below:
•water (quantity)
-harvesting: =IF(OR(AEZ="tropic warm semi-arid",AEZ="sub-tropic warm semi-arid",
AND(AEZ="tropic warm semi-arid",slope 5-15%=1),AND(AEZ="sub-tropic warm semi-
arid", slope 5-15%=1),slope >15%=1,soil texture="sand"),1,0)
-retention: =IF(OR(AEZ="tropic warm semi-arid",AEZ="sub-tropic warm semi-arid",
AND(AEZ="tropic warm semi-arid",slope 5-15%=1),AND(AEZ="sub-tropic warm semi-
arid", slope 5-15%=1), slope >15%=1, soil texture ="sand"),1,0)
-use efficiency: =IF(OR(AEZ="tropic warm semi-arid",AEZ="sub-tropic warm semi-
arid", AND(AEZ="tropic warm semi-arid", slope 5-15%=1),AND(AEZ="sub-tropic
warm semi-arid", slope 5-15%=1),slope >15%=1,soil texture="sand"),1,0)
a. soil (fertility)
-conservation: =IF(OR(soil texture="sand", soil texture ="silt", slope
>15%=1,AND(AEZ="tropic warm semi-arid",soil texture="clayey"),AND(AEZ ="sub-

WRC K4/2719 Deliverable 5: Interim report; Refined decision support system for smallholder CSA-October 2018
81
tropic warm semi-arid",soil texture="clay")*AND(AEZ="tropic warm semi-arid",
slope 5-15%=1)*AND(AEZ="sub-tropic warm semi-arid", slope 5-15%=1)),1,0)
-improvement: =IF(OR(soil texture="sand",soil OC<2),1,0)
a. crop/tree resistance and efficiency
-water: =IF(OR(AEZ="tropic warm semi-arid", AEZ ="sub-tropic warm semi-arid",soil
texture ="sand", slope >15%=1),1,0)
-heat: =IF(OR(AEZ ="tropic warm semi-arid", AEZ ="sub-tropic warm semi-arid", soil
texture ="sand"),1,0)
-nutrient: =IF(OR(AEZ ="sub-tropic cool sub-humid", slope >15%=1,'DSS_input
'!J4="sand"),1,0)
-disease:=IF(OR(AEZ ="sub-tropic cool sub-humid"),1,0)
a. Livestock resistance and efficiency
-water: =IF(OR(AEZ="tropic warm semi-arid", AEZ ="sub-tropic warm semi-arid"),1,0)
-heat: =IF(OR(AEZ ="tropic warm semi-arid", AEZ ="sub-tropic warm semi-arid"),1,0)
-nutrient: =0
-disease:=IF(OR(AEZ="sub-tropic cool sub-humid"),1,0)
•B. Resources to manage based on physical properties and farming systems (=1)
In case the resource needs to be managed based on the farming system as well, as described in Table
3, it is assigned the value 1, but solely if the value 1 was already assigned to theresource in the
previous table under bullet A. Otherwise it is assigned the value 0. The rules as implemented in Excel
are as follows:
b. water (quantity)
-harvesting:=IF(AND(harvesting_old=1,OR(gardens=1,field=1,livestock,chickens=1,tre
e and natural=1)),1,0)
-retention:
=IF(AND(harvesting_old=1,OR(gardens=1,field=1,livestock,chickens=1,tree and
natural=1)),1,0)
-use efficiency:
=IF(AND(harvesting_old=1,OR(gardens=1,field=1,livestock,chickens=1,tree and
natural=1)),1,0)
c. soil (fertility)
-conservation:=IF(AND(harvesting_old=1,OR(gardens=1,field=1,livestock,chickens=1,t
ree and natural=1)),1,0)
-improvement:=IF(AND(harvesting_old=1,OR(gardens=1,field=1,livestock,chickens=1,
tree and natural=1)),1,0)
b. crop/tree resistance and efficiency
-water: =IF(AND(water_old=1,OR(gardens =1, field=1, tree and natural =1)),1,0)
-heat: =IF(AND(heat_old=1,OR(gardens =1, field =1, tree and natural =1)),1,0)
-nutrient: =IF(AND(nutrient_old=1,OR(gardens =1, field =1,tree and natural =1)),1,0)
-disease: =IF(AND(disease_old=1,OR(gardens =1, field=1, tree and natural =1)),1)
b. disease:=IF(AND(water=1,OR(gardens =1, field =1, tree and natural =1)),1,0)
Livestock resistance and efficiency
-water: =IF(AND(water_old, livestock,chickens =1),1,0)
-heat: =IF(AND(heat_old, livestock,chickens =1),1,0)
-nutrient: =IF(AND(nutrient_old, livestock,chickens =1),1,0)

WRC K4/2719 Deliverable 5: Interim report; Refined decision support system for smallholder CSA-October 2018
82
-disease:=IF(AND(disease_old, livestock,chickens =1),1,0)
“Tab pract. vs res.” sheet
This sheet contains Table 4of section 3.3.2, where the criteria for selecting practices based on the
resources to manage and related strategies have been assigned value 1.The practices that have not
been assigned value 1 are not suited to manage the specific resource.
“Tab pract. vs constrains” sheet
This sheet contains Table 5 of section 3.3.3, where the criteria for constraining the selected practices
based on farmer’s typology, physical environment and farming system have been assigned the value
1. The practices that have not been assigned value 1 are not constrained by the specific physical
environment, the farming practices and/or the typology.
“Tab score facilitator” sheet
This sheet contains Table 6 of section 3.3.4.1, where scores, between 0 and 3, are assigned by a
facilitator to each resource and per practice based on the estimated beneficial impact of the practice
on the specific resource; i.e.water, soil, crop, livestock and natural. The last column of this table
contains the sum of the scores per practices; the highest the score, the most beneficial the practice is
on the different resources according to the facilitator.
“Tab score farmers” sheet
This sheet contains a table with the scores, 1 up to 3, assigned per practice by the farmers to 5 different
themes, as described in section 3.3.4.2; i.e. labour intensity, investment, skills, farm productivity and
water saving. Concerning intensity, investment and skills, the values go from 1 for high intensity to 3
for low intensity, and concerning productivity and water saving, the values go from 1 for low impact
to 3 for high impact. The last column contains the sum of the scores per practice; the highest the score,
the closest the practice fits the farmer’s aspiration.
“Example for HH1” sheet
This sheet highlightsthe practices that have been selected by the DSS to manage the resources for the
farming HH number 1, as suggested by the physical environment and the farming system, and not
constrained by the environment, the farming system and the typology. This has been computed in 4
consecutive steps, represented by 4 consecutive tables within this sheet:
•A. Suggested practices based on physical environment and farming system (=1)
A practice is selected and gets value 1 if it can be used to manage a resource that needs to be managed
based on the physical environment. By consequence this step combines sheet 'Resources to manage'
and sheet 'Tab pract. vs res.'
•B. Suggested practices that are not constrained by physical environment and/or typology
(=1)
Per physical environment and typologyvariable, thepractice is assigned a value, 0 or 1, according to
fact if it is constrained (=1) or not (=0) by this variable. If the sum of all values, 0 or 1, per practice is

WRC K4/2719 Deliverable 5: Interim report; Refined decision support system for smallholder CSA-October 2018
83
larger than 0, then the practice is assigned a value 1 (not constrained). By consequence, this step
combines sheet 'DSS_input and sheet 'Tab pract. vs constrains'.
•C. Suggested practices that are not possible due to farming system (=0)
Apractice is assigned a value, 0 or 1, according to fact ifit is constrained (=0) or not (=1) by this variable.
•D. Suggested practices that are not constrained by physical environment, typology and/or
farming system (=1) / farming system
This table is a combination of the table under bullet point B and C. If the practiceis not constrained by
physical environment and typology (practice in table B with value 1) and not constrained by the
farming system (practice in table C with value 1), then the practice in table D is assigned value 1,
otherwise it is assigned value 0.
The rankings based on the score provided by facilitator and the ranking based on the score provided
by the farmer are still in progress, since this will be tackled in the feedback step of the whole DSS
process.
Case study for 26 households in South Africa
Description and analysis of DSS input for 26 households
Figure 5: Location of the villages where the household surveys has been performed.

WRC K4/2719 Deliverable 5: Interim report; Refined decision support system for smallholder CSA-October 2018
84
Field surveys were performed by Mahlatini Development Foundation in 26 Households (HH) located
in 10 villages spread over three provinces in South Africa; (1) 6 HH are located Limpopo, in the village
Sekororo, close to Tzaneen, (2) 6 HH are located in KZN, with 2 HH in Ntabamhlophe, close to Escourt,
1 in Eqeleni and 3 in Ezibomvini, both close to Bergville, and (3) 14 in Eastern Cape, with 7 HH in
Mxumbu and 1in Nowawe, both close to Alice, 2 in Dimbaza, 1 in Xhukwane, 1 in Ginsberg and 2 in
Quzini, all close to King Williams Town. Those villages are provided in the map of Figure 5.
For each of the 26 HH, the physical environment data were extracted from thedifferent available
datasets, as described in section 3.2.1. The physicalenvironment for the 26HH is provided in Table B.1
of Appendix B. According to the AEZ dataset (Sebastian, 2014; HarvestChoice, 2011), the villages
around Alice and King Williams Town (Eastern Cape) are located in a sub-tropic semi-arid warm zone,
the villages around Bergville and Escourt (KZN) are located in a sub-tropic sub-humid cool zone, and
the villages around Tzaneen (Limpopo) are located in a tropic semi-arid warm zone (Figure5). The
slopes of the terrain are larger than 5% in 11 out of the 26HH and are located in Eastern Cape in the
villages of Mxumbu, Dimbaza, Nowawe and Xhukwane.
Based on the AfSoilGrids 250m soil database (Hengl et al., 2017)and the soil texture triangle, as
represented in section 3.1.2.1, the soil texture at all 26 farms is classified as loamy. However according
to the soil samples taken by Mahlatini Development Foundation, the soils in Sekororo (Limpopo) are
sandy, those in Eqeleni, Ezibomvini (KZN) and Mxumbu (Eastern Cape) are clayey. Therefore, this has
been adapted as input for the DSS. The soil organic carbon content (OC) has been extracted from the
same AfSoilGrids 250m soil database. According to this database, all soils contain between 0.5% and
2% OC, except 4 HH located in Eastern Cape, in thevillages of Dimbaza(2), Nowawe (1)and Xhukwane
(1), where the OC is larger than 2%. According to Mahlatini Development Foundation, these values for
the HH in Eastern Cape are probably too high. Since no sampling data were available for the HH in
Eastern Cape, the OC values provided by the AfSoilGrids 250m soil database have been used as input
for the DSS, and have not been adapted.
Based on the fieldsurveys in the different villages, information on farming system and socio-economic
background has been collected. These data for the 26 HH are provided in Table B.2 of Appendix B.
A correlation analysis has been performed between the different input datasets. This analysis shows
that each province is characterised by a different AEZ, and that the soil texture and OC are significantly
different between provinces, but to a lesser extent than the climate. The same is valid concerning the
topography; terrain slopes also differ significantly between provinces. In addition to this, this table
shows some more interesting correlations; size of the farm and farming system also relate to the
provinces. None of the households in Limpopo have livestock or chickens and all of them have farms
with a size less than 1ha. Most of the farming households that have fields are not into orchards, trees
or use of natural resources.
DSS intermediate and final outputs description and analysis
Typology

WRC K4/2719 Deliverable 5: Interim report; Refined decision support system for smallholder CSA-October 2018
85
Based on the rules defined in Table 2 of section 3.2.3, 8 HH are classified as typology A, 8 as typology
B and 10 as typology C. Table 7 provides the typology as suggested by the DSS for the 26 households.
This Table has been extracted from the DSS Excel sheet “Typology”. In this table, the typology of the
HH is highlighted in grey and has been assigned a value 1.
no. of
participant
Name& SurnameVillageTypology ATypology BTypology C
1
ChenneMailula Sekororo010
2Lydia Sechube
Sekororo1 0 0
3
XhukwaneSekororo0 1 0
4
Masine Morerwa Sekororo001
5
Mdimi Shai Sekororo010
6
Flora Maimela Sekororo100
7
WinnieDlaminiNtabamhlophe 010
8
Zanele NgobeseNtabamhlophe001
9
Ntombakhe Zikode Eqeleni100
10
Nombono DladlaEzibomvini100
11
Zodwa Zikode Ezibomvini100
12
Phumelele Hlongwane Ezibomvini010
13
PhezaMakisiMxumbu001
14
Bongiwe MxonywaMxumbu100
15
Xolisa DwaneMxumbu001
16
Mncadi MabandlaMxumbu001
17
Mandisa MamaMxumbu001
18
Siyabulela GungqceniMxumbu010
19
Thangolomuzi HoganaMxumbu001
20
Aviwe BikoDimbaza100
21Jack MphangeliNowawe100
22
Jende MonwabisiXhukwane010
23
Tshembela NadathiniDimbaza001
24
Parichi EdmoreGinsberg010
25
Msisiwe PhindiweQuzini001
26
NomasomiMjacuQuzini001
Table 7: Typology of 26 households as assigned by the DSS.
The statistical analysis of the input dataset, as described in previous section 4.1, and the typology of
each farming HH, as provided in Table 7, shows that the typology is significantly related to the gender
of the HH-head, the total HH income, the access or not to tap water, the access or not to formal
markets and the size of the farm. 75% of the typology A HH have a female household head, have no
access to tap water and have an income lower than R2000. Concerning typologyB, only the gender
relates significantly; all HH heads are males. Concerning typology C, 63% of the HH tend to have an
incomehigher than R5000, 90% have access to tap-water, 90% have access to formal markets and
70% have a farm larger than 2ha. The other input variables were not significant at p=0.05.
Resources tomanage
Based on the rules defined in Table 3 of section of 3.3.1, the DSS suggests the resources to manage by
the 26 farming households. These resources and the potential strategies are provided in Table 8 for
the 26 farming households. This Table is based on the output provided in the DSS Excel sheet
“Resources to manage”. In this table, the resourcesto manage by the HH are highlighted in grey and
have been assigned a value 1.

WRC K4/2719 Deliverable 5: Interim report; Refined decision support system for smallholder CSA-October 2018
86
Table 8: Resources to manage on the 26 farms according to the DSS, based on the physical
environment and the farming system.
This Table 8 shows significant differences in resources to manage between villages and between the
management strategies. This is also supported by the statisticalanalysis performed on the input
dataset, as described in section 4.1, and the suggested resources to manage by each farming HH, as
provided in Table 8. This analysis shows that water needs to be managed in all villages except those
no. of
particip
ant
Name & Surname
harvesting
retention
use efficiency
conservation
improvement
water
Heat
nutrient
disease
water
heat
nutrient
disease
1
Chenne Mailula 1111111100000
2Lydia Sechube 1111111100000
3
Dimakatso Thobejane 1111111100000
4
Masine Morerwa 1111111100000
5
Mdimi Shai1111111100000
6
Flora Maimela1111111100000
7
Winnie Dlamini0000000110001
8
Zanele Ngobese0000000110001
9
Ntombakhe Zikode 0000100110001
10
Nombono Dladla0000100110001
11
Zodwa Zikode 0000100110001
12
Phumelele Hlongwane 0000100110001
13
Pheza Makisi1111111100000
14
Bongiwe Mxonywa1111111101100
15
Xolisa Dwane1111111101100
16
Mncadi Mabandla1111111101100
17
Mandisa Mama1111111101100
18
SiyabulelaGungqceni1111111101100
19
Thangolomuzi Hogana1111111101100
20
Aviwe Biko1111011101100
21 Jack Mphangeli1111011101100
22
Jende Monwabisi1111011101100
23
Tshembela Nadathini1111011101100
24
Parichi Edmore1110111001100
25
Msisiwe Phindiwe1110111001100
26
Nomasomi Mjacu1110111001100
B. Resources to manage based on physical properties and farming systems (=1)
Physical properties +farming system
Resources and management strategies
water (quantity)
soil (fertility)
crop/tree resistance and efficiency
Livestock resistance and efficiency

WRC K4/2719 Deliverable 5: Interim report; Refined decision support system for smallholder CSA-October 2018
87
located in KZN where the climate is more humid (tropic sub-humid cool). Concerning the soil,
conservation practices,these are mainly suggested on the poorly structuredsoils, the sandier soils
located in the Limpopo province. The soil fertility is suggested to be improvedon all farms except
those with slightly higher organic matter; i.e. 2 HH is KZN and 4 HH in Eastern Cape. Concerning
resistance and efficiency of crop and livestock, water andheat are suggested to betackled at allfarms,
except those located in the cooler and more humid KZN. In this province however, diseases are
suggested to be managed since more humid climate favours disease development. There is no need
to manage resistance and efficiency of livestock and chicken in the 6 farms in Limpopo since this
farming system is not represented here. A more efficient uptake of nutrients by crop is suggested
everywhere, except on 3farms in Eastern Cape, where nutrient leaching or run off are minimised.
Currently the management of livestock nutrient efficiency has not yet been defined in the DSS.
Suggested practices based on the resources to manage
Based on the rules defined in Table 5 of section 3.3.2 and on the physical environment as well as the
farming system,the DSS suggests practices that could be used by the 26 farming households to
manage the resources. These suggested practices, highlighted in light and dark grey, are provided in
Table 9 for the 26 farming households.This Table is based on the output provided in the DSS Excel
sheet “Output for HHx”
Suggested practices constrained by farmertypology,farming system and or physical
environment
Based on the rules defined in Table 4 of section 3.3.3, the physical environment, farming system, and
typology constrain the number of suggested practices. The practices suggested in previous section
that are not constrained are highlightedin dark grey inTable 9 for the 26 farming households.This
Table is based on the output provided in the DSS Excel sheet “Output for HHx”
The analysis of Table 9 shows that some practices are suggested for all 26HH, based on the resources
to manage (light and dark grey); i.e.:
•Shade cloth tunnels
•Mulching
•Improved organic matter
•Targeted application of small quantities of fertilizer, lime etc
•Liquid manures
•Woody hedgerows for browse, mulch, green manure, soil conservation
•Conservation Agriculture
•Planting legumes, manure, green manures
•Mixed cropping
•Planting herbs and multifunctional plants
•Agroforestry
•Trench beds/ eco-circles
•Integrated weed management
•Breeding improved varieties
•Seed production / saving / storing
•Crop rotation

WRC K4/2719 Deliverable 5: Interim report; Refined decision support system for smallholder CSA-October 2018
88
•Tower garden
•Keyhole beds
But only four of these are finally selected since not constrained by the physical environment, farming
system or farmers typology; i.e
•Improved organic matter
•Integrated weed management
•Breeding improved varieties
•Seed production / saving / storing
Crop rotation is solely constrained in 1 out of the 26 cases due to the fact that the farming HH had no
garden or field.
In opposite to this, some practices seemed to be unsuitable in all 26 cases:
•Drip irrigation
•Bucket drip kits
•Furrows and ridges/ furrow irrigation
•Shade cloth tunnels
•Small dams
•Contours; ploughing and planting
•Stone bunds
•Terraces
•Trench beds/ eco-circles
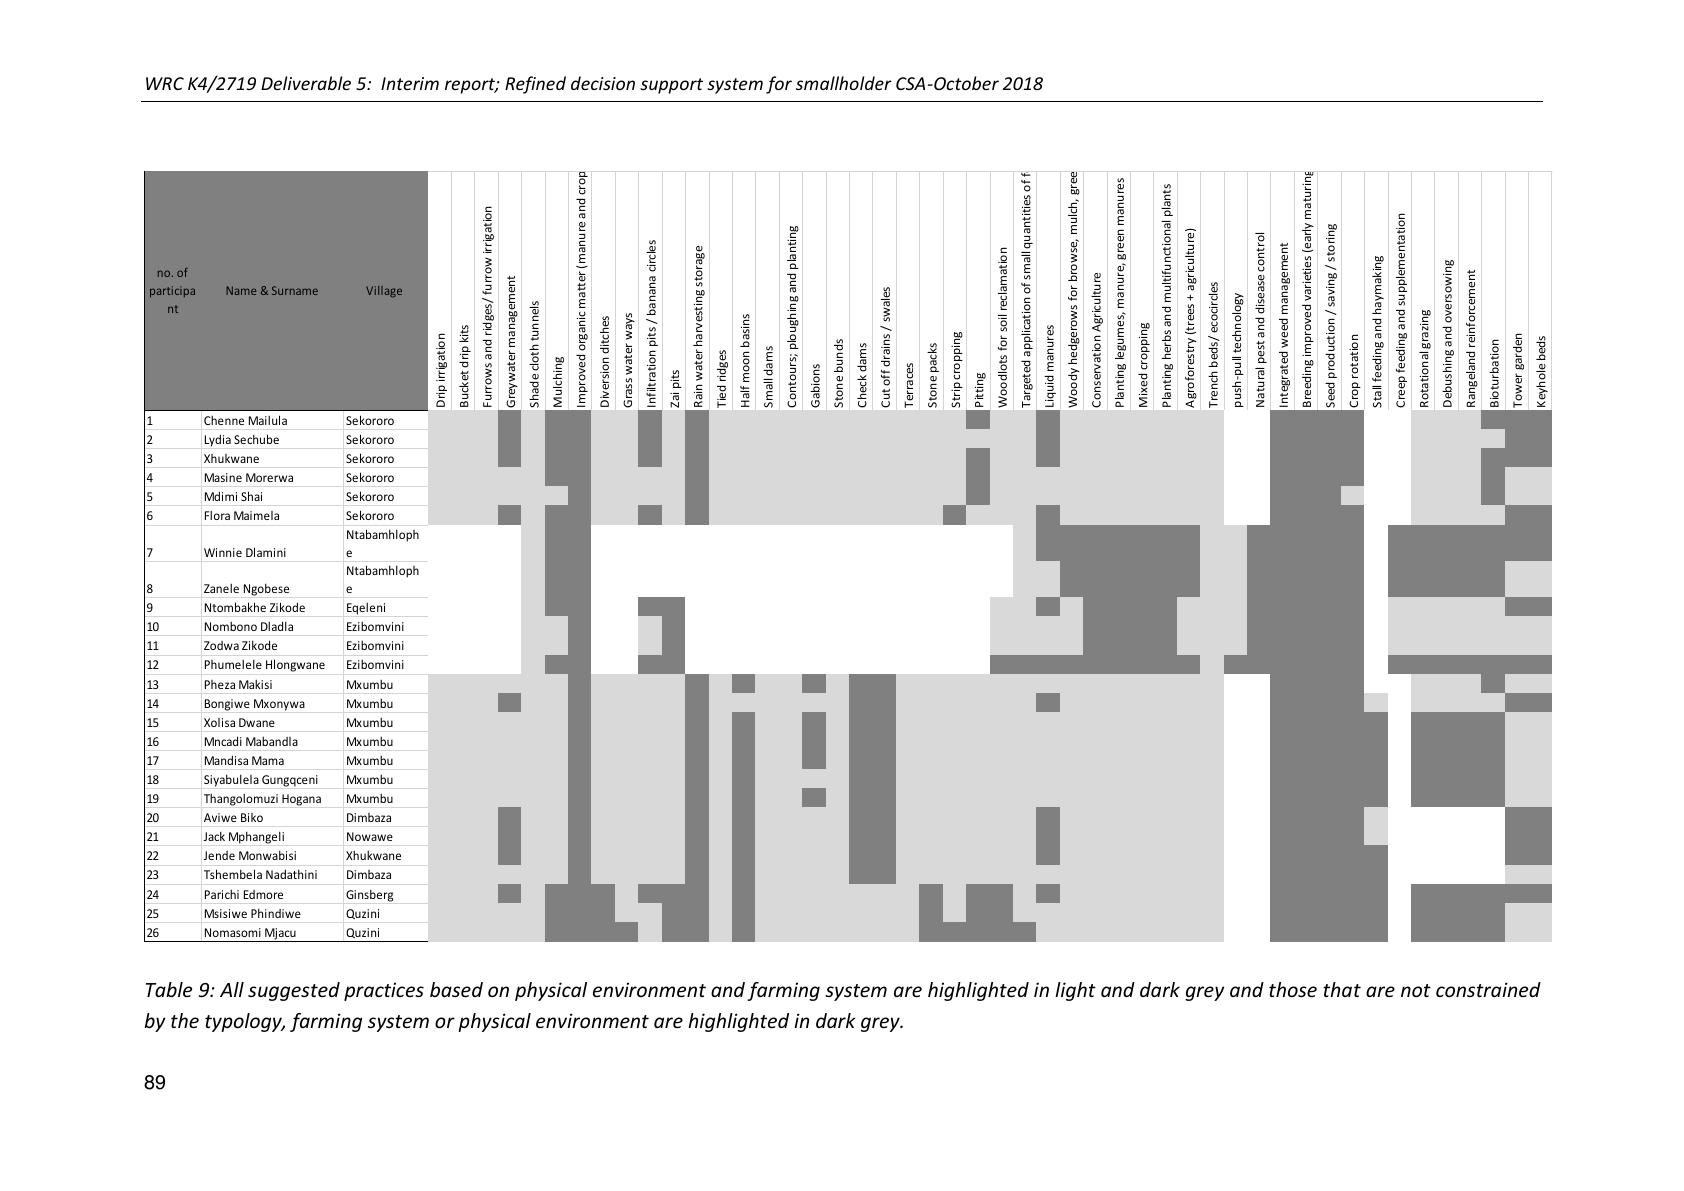
WRC K4/2719 Deliverable 5: Interim report; Refined decision support system for smallholder CSA-October 2018
89
Table 9: All suggested practices based on physical environment and farming system are highlighted in light and dark grey and those that are not constrained
by the typology, farming system or physical environment are highlighted in dark grey.
no. of
participa
nt
Name & Surname Village
Drip irrigation
Bucket drip kits
Furrows and ridges/ furrow irrigation
Greywater management
Shade cloth tunnels
Mulching
Improved organic matter (manureand crop residues)
Diversion ditches
Grass water ways
Infiltration pits / banana circles
Zai pits
Rain water harvesting storage
Tied ridges
Half moon basins
Small dams
Contours; ploughing and planting
Gabions
Stone bunds
Check dams
Cut off drains / swales
Terraces
Stone packs
Strip cropping
Pitting
Woodlots for soil reclamation
Targeted application of small quantities of fertilizer, limeetc
Liquid manures
Woody hedgerows for browse, mulch, green manure, soil conservation
Conservation Agriculture
Planting legumes, manure, green manures
Mixed cropping
Planting herbs and multifunctional plants
Agroforestry (trees + agriculture)
Trench beds/ ecocircles
push-pull technology
Natural pest and disease control
Integrated weed management
Breeding improved varieties (early maturing, drought tolerant, improved nutrients)
Seed production / saving / storing
Crop rotation
Stall feeding and haymaking
Creep feeding and supplementation
Rotational grazing
Debushing and oversowing
Rangeland reinforcement
Bioturbation
Tower garden
Keyholebeds
1
Chenne Mailula Sekororo
2Lydia Sechube
Sekororo
3
Xhukwane Sekororo
4
Masine Morerwa Sekororo
5
Mdimi Shai Sekororo
6
Flora Maimela Sekororo
7
Winnie Dlamini
Ntabamhloph
e
8
Zanele Ngobese
Ntabamhloph
e
9
Ntombakhe ZikodeEqeleni
10
Nombono DladlaEzibomvini
11
Zodwa Zikode Ezibomvini
12
Phumelele Hlongwane Ezibomvini
13
Pheza MakisiMxumbu
14
Bongiwe MxonywaMxumbu
15
Xolisa DwaneMxumbu
16
Mncadi MabandlaMxumbu
17
Mandisa MamaMxumbu
18
Siyabulela GungqceniMxumbu
19
Thangolomuzi HoganaMxumbu
20
Aviwe BikoDimbaza
21 Jack MphangeliNowawe
22
Jende MonwabisiXhukwane
23
Tshembela NadathiniDimbaza
24
Parichi EdmoreGinsberg
25
Msisiwe PhindiweQuzini
26
Nomasomi MjacuQuzini

WRC K4/2719 Deliverable 5: Interim report; Refined decision support system for smallholder CSA-October 2018
90
Ranking of suggested practices based on score provided by facilitator and farmer.
Based on scores provided by the facilitator and the farmer as defined in section3.3.4, the practices
highlighted in dark grey in Table 9, can be ordered by preferences. In Table 10 a ranking,based on
facilitator’s scores, is provided for the farming HH ‘Mdimi Shai’located in Sekororo, Limpopo.
According to the facilitator, improving organic matter and pitting are the most appropriate practices
suggested by the DSS for this HH, which is only farming trees and natural resources, regarding the
impact on the resources to manage.
Table 10: Ranking of suggested practices, based on the scores provided by a facilitator, for farming HH
Mdimi Shai located in Sekororo, Limpopo.
Conclusion, further work and limitations of the DSS
In this report, the conceptual framework of the DSS, including inputs, processes and output has been
introduced. The implementation of the conceptual DSS into Excel has been described, and the DDS
has been run for 26 farming households, based on input data from state-of-the art studies and on the
results of the field survey. The 26HH are located in 3 different provinces in South Africa; i.e. Limpopo,
KZN and Eastern Cape. The soil texture input data taken from the AfSoilGrids 250m soil database
seemed to be too generic and not appropriate to the scale of the farming systems and has therefore
been adapted with the information provided from the soil samples taken by Mahlathini Development
Foundation.
At a first glance the practices suggested by the DSS are shown to be sensitive to the physical
environment, the farming system and the farmers socio-economic background. The DSS has however
not yet gone through an in-depth evaluation. Therefore, in a next step, it is suggested to perform
sensitivity analysesandto validate the output of the DSS against observations. The practices suggested
by the DSS need now also to be discussed with farmers and facilitators. Based on their feedback,tables
with ranking of practices will be built. In addition, the DSS will go through a reiteration process and
might need in depth adaptations. This might for example be the case of the different rules provided
in Tables 3-5 on resources to manage and the suggested practices. For example, in south Africa,water
is very scarce and thereforeit might be more appropriate to suggestto manage water resources under
all conditions and not only in semi-arid climate, or on sandy soils, or on undulating up to very steep
slopes.

WRC K4/2719 Deliverable 5: Interim report; Refined decision support system for smallholder CSA-October 2018
91
The list of management practices needs to be extended, as well as thedescriptions in Appendix A. In
addition, some practices might need tobe split-up in sub-categories; eg. into “constructed” and “dug”
since both differ in requirements.
Finally, the next step is toaccess the data concerning future climate, and in particular the geographical
spread of the AEZ according to future projects, and run the DSS using this dataset, and evaluate the
impact on the suggested practices.
Appendix A: Benefits and requirements for management practices
•Drip irrigation: reduces water use; 30-50% less thanconventional watering methods such as
sprinklers. Smaller amounts of water are applied locally over a longer amount of time provide
ideal growing conditions and reduces leaching. Appropriate for most agro-ecological zones and
most soil types- although very sandy soils and heavy clays need additional management support
•Bucket drip kits: Inbucket kit drip irrigation, water flows into the driplines from a bucket reservoir
placed 0.5–1 m above the ground to provide the required water pressure. It is fitted for gardens
less than 0.1ha. It requiresmedium cost, skills and labour, with easy maintenance.Appropriate
for most agro-ecological zones and most soil types-although very sandy soils and heavy clays
need additional management support
•Furrows and ridges:A bed design techniques appropriate forgardens and fields (0,1-2ha),
designed on contour to manage flow of water –which is a form of furrow irrigation. Assists in
efficient use of water and soil conservation. Crops are planted on the tops or sides of the ridges
-requires additionalmanagement such asmulchingand improved organic matter to be effective-
especially in more arid, hot climates with sandier soils, as well as heavy clay soils.It requires
temperatures above 5°C, precipitation rate above 150mm/year and slopes less than 5%.
•Furrow irrigation: reduces water use and protects soil from erosion. Itincludes lower initial
investment of equipment and lower pumping costs as it relies on gravity assisted water flow in
the furrows. Disadvantages include greater labour costs and lower application efficiency
compared to sprinkler and subsurface drip irrigation. It is suitable for gardens and fields up to
2ha. Itrequires temperatures above 5°C, precipitation rate above 150mm/year and slopesof less
than 5%. Itis not appropriate in very sandy soils or very well drained soils as the soil dries out too
fast.
•Greywater irrigation: reduces the use of freshwater and the amount of wastewater. Greywater
contains nutrients, such as nitrogen and phosphorus, that can be beneficialto plant growth,
which would otherwise be wasted. It is fitted for small areas, but not on slopes.
•Shade cloth tunnel: reduces heat and by consequence evapotranspiration, as well as pest
incidence. It is fitted for gardens less than 0.1ha. It requires medium cost, skills and low
maintenance. It helps reduce stress in plants due to weather variability, increases efficiency of
water use and assists in soil conservation. As the assumption is that irrigation is available it is
suited to most agro-ecological zones, with different heat and rainfall options as well as most soil
types.
•Mulching: Reduces water use as itprotects the soil from evaporation. Provides
valuable nutrients as the mulch breaks down and thereby improve the soil's texture and protects
soil from erosion. Encourages worms, which aerate the soil and provide fertiliser in the form of

WRC K4/2719 Deliverable 5: Interim report; Refined decision support system for smallholder CSA-October 2018
92
worm castings. Reduces the numberof weeds by inhibiting the germination of weed seeds.It is
fitted for gardens less than 0.1ha. It requires low cost and skills but is labour intensive.
Temperatures need to be higher than 5°C and precipitation rate above 150mm/year. Mulching
can be problematic on steep slopes as it washes and blows away. Only local resources are
required to implement this practice.
•Manure and crop residues: improve soil structure, increase organic matter content in the soil,
reduce evaporation, reduces soil borne diseases, keep soil cooler and help fix CO2in the soil. They
enhance the water holding capacity of sandy soils, while it improves the drainage of clayey soils.
•Diversion ditches: are constructed along the contour lines and across slopes for the purpose of
intercepting surface runoff and diverting it to suitable outlets or for rain waterharvesting. It is
fitted for gardens and fields up to 1ha. It requires low cost, skills and maintenance but is labour
intensive. Temperatures need to be higher than 5°C and precipitation rate above 150mm/year.
The slopes cannot be steeper than 10% and the soil should be relatively stable. Onlylocal
resources are required.
•Grass water ways: carry large flows, making it suited to safely carry runoff from large upstream
watersheds anddivertit to suitable outletsor for rain water harvesting. Once vegetation is
established, maintenance is low. However, working around the waterway with farm equipment
can be difficult. It is only implemented in the context of field cropping and not at the smaller scale
of gardening.
•Infiltration pits(withe.g. banana): this practice includes placing organic matter in the pits. It
collects runoff which is stored in the infiltration pit and improves water retention by allowing
water to infiltrate slowly. This technique is appropriate for small-scale tree planting in any area
which has a moisture deficit. Besides harvesting water for the trees, it simultaneously conserves
soil. They are relatively easy to construct and well suited for hand construction. Once the trees
are planted, it is not possible to operate and cultivate with machines between the tree lines. It is
fitted for gardens less than0.1ha. It requires low cost and skills butis labour intensive.
Temperatures need to be higher than 5°C and precipitation rate above 150mm/year. The slopes
need to be less than 30% but there is no soil type restriction. Only local resources are required.
•Zai pits (planting pits): improve infiltration of the captured runoff. The holes are deepened each
winter. Improvements in the traditional pits by the addition of fertilizer and organic matter
(compost) have resultedin dramatic improvements in yield. The pits are easy to manage. It is
designed to be implemented in field cropping where slopes are <10%.
•Rain water harvesting storage: Different storage options are possible. Underground tanks collect
runoff water. It requires high cost and skills, intensive labour but medium maintenance.
Temperatures need to be higher than 5°C and precipitation rate above 450mm/year. The slopes
need to be less than 30% but there is no soil type restriction.
•Tied ridges: collects rainfall from an unplantedsloping basin and catching it with a furrow and
ridge. Tied ridges assist in soil conservation and water infiltration. Planting takes place on either
side of the furrow where the water has infiltrated. It requires low cost but intensive labour.
Temperatures need to be higher than 5°C. The slopes need to be less than 7% and the soil should
be relatively stable. Suitable for areas between 0,1-1ha.
•Half-moon basins: small semi-circular earth bunds for catching water flowing down a slope. These
are usually constructed for planting of trees in a natural landscape. No suitable for gardens as the
basins need tobe quite large to intercept runoff coming downslope. Suitable for areas with
rainfall >450m per year. Soils need to be stable and not too sandy

WRC K4/2719 Deliverable 5: Interim report; Refined decision support system for smallholder CSA-October 2018
93
•Small dams: can be dug in soils that can hold water –they tend to lose water and only stay full
for a short period –but provide a lot of water to the soil profile in the area. Usually they are dug
in places where smallsprings can fill them up on a continuous basis. It requires low cost and skills
but requires intensive labour. Temperatures need to be higher than 5°C. It is suitable for gardens
up to 1ha. The soil should be relatively stable and slopes between 5-15%
•Contours ploughing and planting: createsa water break which reduces erosion
by ploughing and/or planting across a slope following its elevation contour lines.The water break
also allows more time for the water to settle into the soil. This method is suggested when slopes
are between 5-15%. Suitable for areas between0,1-2ha.
•Gabions: is a cage, cylinder, or box filled with rocks, concrete, or sometimes sand and soil used
for erosion control. Gabions are expensive, labour intensive and require skill, so not really
implementable on small scale. They are used for erosion control ins natural landscapes where
high levels of water erosion occur.
•Stone bunds: are used along contour lines to slow down, filter and spread out runoff water, thus
increasing infiltration and reducing soil erosion. It requires stones of different sizes. It is of low
cost and skills but requires intensive labour. Temperatures need to be higherthan 5°C and
precipitation rate above 150mm/year. It is suitable for fields and gardens of all sizes. The soil can
be of any type, but stones are required, which is often not the case in sandy soils. The slopes need
to be between 5-15%.
•Check dams: are small, sometimes temporary damsconstructed across a drainage ditch, or
waterway to counteract erosion by reducing water flow velocity and allowing sedimentation of
silt. It requires low cost and skills but requires intensive labour. Temperatures need to be higher
than 5°C and precipitationrate above 150mm/year. It suitable for fields and garden of all sizes.
The soil can be of any type. This method is suggested when slopes are > 2.5% but < 25%.
•Swale/ cut off drain: is an earth bank constructed along the contour with a furrow on the up-
slope side. The top of the earth bank is levelled off to allow planting. The swale intercepts runoff,
spreads it out and helps it infiltrate deep into the ground. It requires low cost and skills but
requires intensive labour. Temperatures need to be higher than 5°C and precipitation rates above
150mm/year butless than 1200mm/year.It suitable for fields and gardenof all sizes. The soil can
be of any type but not too clayey or sandy. This method is suggested when slopes are > 5% but <
25%.
•Terrace: is a level strip of soil built along the contour of a slope and supported by an earth or
stone bund, or rows of old tyres. A series of terraces creates a step-like effect which slows down
runoff, increases the infiltration of water into the soil, and helps control soil erosion. It requires
low cost but requires intensive labour. Temperatures need to be higher than 5°C and precipitation
rate above 350mm/year. It suitable for fields and garden of all sizes. The soil can be of any type.
This method is suggested when slopes are > 10% but < 40%.
•Stone packs: are built on contour across erosion ditches and gulleys, to slow down water flow,
improve infiltration of water and promote sedimentation. They are suitable for fields and gardens
of all sizes and but used primarily in a natural landscape as an erosion control measure
•Strip cropping: This is a technique used in field cropping (any size field) where strips of natural
vegetation (on contour) are left in between the areas of planting to prevent erosion and improve
water infiltration. The width of the strips and planting areas depend on the slope. Generally

WRC K4/2719 Deliverable 5: Interim report; Refined decision support system for smallholder CSA-October 2018
94
slopes of 5-30% are acceptable. The technique is possible in all soil types, with a rainfallof
>450mmm per year.
•Pitting: it is used to rehabilitate denuded areas, where hard pans have developed and is primarily
a method for rehabilitation of natural landscapes-not used in gardening or field cropping
situations.
•Mixed woodlots: are established to reduce erosion and increase soil fertility in landscapes where
erosion is occurring. Trees provide soil cover and stabilise the soil. Depending on tree species, it
can improve water retention. It is not implemented in a gardening or field cropping context. It
needs a minimum of around 350mm rainfall and it is not appropriate to very sandy soils.
•Trees: Planted for fodder, honey production, timber, shade, fruit, medicinal purposes, erosion
control and soil fertility. It is implemented in a gardening or field cropping context. It needs a
minimum of around 350mm rainfall and is appropriate to all soil types-given the assumption of
irrigation for establishment.
•Windbreaks: Bushes and trees are planted in banks across the line ofthe major destructive winds
in the area (either cold or hot)to protected planted crops in gardens, fields and orchards. It needs
a minimum of around 350mm rainfall and is appropriate to all soil types-given the assumption
of irrigation for establishment.
•Targeted applicationof fertilizer and lime: fertilizers are added according to soil fertility
recommendations,targeted next to growingplants rather than spreading or banding. Lime can
be added toreduce soil acidification and maintain low acid saturation. It requires medium cost
and intensive labour. Temperatures need to be higher than 5°C and precipitation rate should be
above 450mm/year. It suitable for fields of all sizes. It is not well suitedto sandy soils. This method
is suggested when slopes are < 10%.
•Liquid manure: fermented manure or green waste diluted in water to fertilise gardens. It provides
water, nutrients and some protection against pests and diseases. It requires low cost and labour.
It is only suited for small areas such as gardens.
•Woody hedgerows: can be used for browse, mulch, green manure, soil conservation,etc. It
requires a minimum of 350mm rainfall. It is not suited for very sandy soils, and small areas such
as gardens.
•Conservation agriculture: comprises (1) minimal soil disturbance-no ploughing, (2) soil cover –
through stover, mulches and cropping cycles, and (3) diversification; intercropping, relay
cropping, cover crops (legume- brassicas and grain mixtures). It also provides fodder for cattle. It
requires medium cost and intensive labour. Temperatures need to be higher than5°C and
precipitation rate above 350mm/year. It suitable for fields and gardens of all sizes. The soil can
be of any type, but is difficult to implement on soils with low soil organic carbon content. This
method is suggested when slopes are < 15%.
•Planting legumes (e.g. during fallow): crop rotation,intercroppingrelay cropping and fallow
cropping with legumes (either annualsor perennials) assist in building and maintaining soil
fertility and soil health. Crops can be worked into the soil as green manure, slashed and left as
soil cover, or harvested for fodder and food depending on the situation. Since legumes fix their
own nitrogen from the atmosphere, green manuring can maintain or improve soil fertility
without direct costs for fertilizer. It improves soil structure, supresses weeds, control pest and
lets the soil rest. It requires medium cost and it is easy do. It suitable for fields and garden of all

WRC K4/2719 Deliverable 5: Interim report; Refined decision support system for smallholder CSA-October 2018
95
sizes. The soil can be of any type but is difficult to implement on soils with very low soil organic
carbon content. The precipitation rate needs to be above 350mm/year
•Mixed cropping/intercropping: promotes soil organic matter build up, improves soil fertility and
balanced use and provision of nutrients, soil structure and soil health, reduces prevalence and
types of weeds, andhelpsto manage the pests and disease incidenceand severity.It requires low
cost and it is easy do. Itis suitable forfields and garden of all sizes. The soil can be of anytype but
is difficult to implement on soils with very low soil organic carbon content. The precipitation rate
needs to be above 350mm/year.
•Crop diversification:In all contexts; gardens, fields and livestock (including alternative fodder
crops) and orchards, increase the variety of crops planted to ensure a range of options for
nutrient uptake, drought and heat tolerance, early and late maturing and continuity in food
production. Focus to be on open pollinated and heirloom varieties to ensure seed savingoptions.
Varieties are chosen to suit local agroecology, weather and soil conditions and thus suitable for
all areas
•Planting herbs/ multifunctional plants: Mixed cropping with herbs and multifunctional plants for
culinary and medicinal purposes and also to control pests and diseases in the garden/ field.It
requires medium cost and it is easy do. It suitable for fields and garden of all sizes. The soil can
be of any type but is difficult to implement on soils with low soil organic carbon content. The
precipitation rate needs to be above 350mm/year.
•Agroforestry: Trees,mostly fodder species, are mixed intothe farming system either as fallows,
monocrops or between annual crops (usually as strip cropping in rows). It requires medium cost
and intensive labour and knowledge. Temperatures need to be higher than 5°C and precipitation
rate above 350mm/year. It is suitable for fields and garden of all sizes. The soilcan be of any type
but is difficult to implement on soils with very low soil organic carbon content.This method is
suggested when slopes are < 15%. It maximises benefits per unit area. It can improve soil fertility
and water holding capacity. The trees can provide fodder, fruit, timber and shade for animals. It
can help to reduce erosion by water and wind.
•Trench beds/ eco-circles: is a way to increase soil fertility and water holding capacity. It reduces
heat, and improves the management of soil borne diseases. It is an intensive way of providing
good soil for vegetables productionon a small scale. It involves digginga hole and filling it with
organic matter, so that your bed can be fertile for a long time. It requires low cost but intensive
labour. Temperaturesneed to be higher than 5°C. It is suitable for smaller garden.The soil can be
of any type. This method is suggested when slopes are between 5-15%. Irrigation is assumed.
•Push-pull technique: is a strategy for controlling agricultural pests by using repellent "push"
plants and trap "pull" plants. It requires knowledge and the correct varieties of plants to provide
the trap and the lure. The soil can be of any type but is difficult to implement on soils with low
soil organic carbon content. The precipitation rate needs to be above 350mm/year. It is suitable
for field cropping of any size and as such is best suited for slopes between 5-15%
•Natural pest and disease control: by mixed cropping, multi-functional plants, good soil fertility
management, pest replant plants, predator attractant plants, and brews. It requires low cost but
medium intensive labour and is knowledge intensive. It suitable for small gardens and fields up
to 1ha. The soil can be of any type.
•Integrated weed management: includes a number of different practices-such as soil health
(structure, fertility), landscape management (e.g.close spacing of crops to shade out weeds),
cultivation, mechanical and chemical control measures. It requires low cost but medium intensive

WRC K4/2719 Deliverable 5: Interim report; Refined decision support system for smallholder CSA-October 2018
96
labour and is knowledge intensive. The soil can be of any type. It is suitable for gardens and fields
of any size. The precipitation rate needs to be above 350mm/year
•Breeding improved varieties:using varieties that are better suited to drought, heat, short growing
seasons, more efficient uptake of nutrients, etc. It is suitable for gardens and fields of any size, in
climates that can sustain plant growth. Actual breeding of plant varieties is not generally within
the ambit of smallholder farmers. They can however experiment with and adapt varieties totheir
situations
•Seed saving/production/storage: of open pollinated or heirloom varieties (not hybrids), that are
locally adapted to climate, pests and diseases. They are genetically diverse. It requires low cost
but is labour and knowledge intensive.
•Crop rotation: helps to break disease cycles and improve soil health, fertility and structure. It can
alleviate the negative factors of monoculture cropping systems. It helps with water and nutrient
use efficiency as different crops use water and nutrients in different ways. Overall financial risks
are more widely distributed over more diverse production of crops. It requires low cost but is
labour and knowledge intensive. It is suitable for gardens and field cropping of any size.
•Stall feeding and hay making: Improving livestock productivity in the area will require strategies
that support forage production and conservation to enhance year-round fodder availability.
Problems in haymaking vary according to the crop, climate and prevailing weather at harvest:
under sub-humid and humid temperate conditions, the main problems arerelated to slowness
of drying, so, to avoid loss by spoilage, the aim is to dry the crop or grass as quickly as conditions
will allow. Typology A is unlikely to have access to livestock, or areas to make hay.
•Supplementation and protein licks: is a livestock management practice used to provide animals
with those nutrients that the pastures lack. It requires medium cost but is labour and knowledge
intensive.
•Rotational grazing and resting of veld: To retain the productivity of grasslands it is necessary to
rest a portion of the grazingarea for a full growing season. This allows the grass plants to store
nutrients in theirroot systems and make thegrasses more nutritious. It is important to work with
livestock owners to work together to develop arotational resting system. It requires medium
cost but is labour and knowledge intensive.
•De-bushing and over-sowing:Bush encroachment is a major problem for livestock. This practice
can help to increase food availability for cattle, by reducing erosion,increasing soil fertilityand
having a general beneficial effect on livestock health -due to reduced load of parasites etc.
Woody vegetation can be removed mechanically or chemically. The cleared areas can be over-
sowed with pasture grass. It requires medium cost but is labour and knowledge intensive.
•Rangeland reinforcement: entails the sowing of improved grass and legume species into native
pasture to improve rangeland productivity.
•Bioturbation: is defined as the reworking of soils and sediments by animals or plants. These
include burrowing, ingestion and defecation of sediment grains. Bioturbating activities have a
profound effect on the environment and are thought tobe a primary driver of biodiversity. In
agriculture this can be achieved primarily through the use of tree species and working with
earthworms. In this context it can also be hoof trampling in veld situations that allow nutrient
and water infiltration and cycling.
WRC K4/2719 Deliverable 5: Interim report; Refined decision support system for smallholder CSA-October 2018
97
•Poultry production options: Broilers, layer and traditional poultry management options for small-
scale implementation including production and processing of local feed, housing, health and
system integration; Mostly for farmers in typologies A and B, appropriate to all areas
•Tower gardens: are built up from the ground by usingfour poles and wrapping a tube of 80%
shade cloth around these poles. The bed is filled in with a pre-prepared mixture of soil, manure,
and ash. Small holes are made in the side of the bag and seedlings are planted vertically into
holes. The top of the bed can be used for planting other crops. It requires low cost and skills. It
suitable for small gardens and is designed for use of greywater.
•Keyhole beds: are intensivebuilt-up beds with a central compost basket/column for wateringand
greywater application. It requires low cost and skills. It suitable for small gardens and is designed
for use of greywater.
References
-Berry, W., Ketterings, Q., Antes, S., Page, S., Russell-Anelli, J., Rao, R. and DeGloria, S., 2007. Soil
texture. Agron Fact Sheet Ser,29, p.1e2.
-Bryan, E., Ringler, C., Okoba, B., Roncoli, C., Silvestri, S. andHerrero, M., 2013. Adapting agriculture
to climate change in Kenya: Household strategies and determinants. Journal of environmental
management,114, pp.26-35.
-Cooper, P.J.M., Dimes, J., Rao, K.P.C., Shapiro, B., Shiferaw, B. and Twomlow, S., 2008. Coping
better with current climatic variability in the rain-fed farming systems of sub-Saharan Africa: An
essential first step in adapting to future climate change?. Agriculture, Ecosystems &
Environment,126(1-2), pp.24-35.
-Dicks, L.V., Walsh, J.C. andSutherland, W.J., 2014. Organising evidencefor environmental
management decisions: a ‘4S’hierarchy. Trends in ecology & evolution,29(11), pp.607-613.
-Du Preez, C.C., Van Huyssteen, C.W. and Mnkeni, P.N., 2011. Land use and soil organic matter in
South Africa 2: A review on the influence of arablecrop production.South African Journal of
Science,107(5-6), pp.35-42.
-FAO, 1978. Report on the agroecological zones project vol. 1: Methodology and results for Africa
World Soil Resources Report No. 48. FAO, Rome.
-Faurès, J.M., Bartley, D., Bazza, M., Burke, J., Hoogeveen, J., Soto, D. and Steduto, P., 2013. Climate
smart agriculture sourcebook. FAO, Rome,557.
-HarvestChoice,2011. "AEZ (16-code) ." International Food Policy Research Institute, Washington,
DC., and University of Minnesota, St.Paul, MN. Available online at
http://harvestchoice.org/node/4772.
-Hengl, T., de Jesus, J.M., Heuvelink, G.B., Gonzalez, M.R., Kilibarda, M., Blagotić, A., Shangguan,
W., Wright, M.N., Geng, X., Bauer-Marschallinger, B. and Guevara, M.A., 2017. SoilGrids250m:
Global gridded soil information based on machine learning. PLoS one,12(2), p.e0169748.
-IPCC 2014. Barros, V.R., Field, C.B., Dokken, D.J., Mastrandrea, M.D., Mach, K.J., Bilir, T.E.,
Chatterjee, M., Ebi, K.L., Estrada, Y.O., Genova, R.C. and Girma, B., 2014. IPCC,2014: Climate
Change 2014: Impacts, adaptation, and vulnerability. Part B: Regional aspects. Contribution of
working Group II to the fifth assessment report of the intergovernmental panel on climate change.
-IPCC 2007. Bernstein, L., Bosch, P., Canziani, O., Chen, Z., Christ, R. and Riahi, K., 2008. IPCC, 2007:
climate change 2007: synthesis report.

WRC K4/2719 Deliverable 5: Interim report; Refined decision support system for smallholder CSA-October 2018
98
-Lipper, L., Thornton, P., Campbell, B.M., Baedeker, T., Braimoh, A., Bwalya, M., Caron, P., Cattaneo,
A., Garrity, D., Henry, K. and Hottle, R., 2014. Climate-smart agriculture for food security. Nature
climate change,4(12), p.1068.
-Parker, C.G., 2004. Decision support tools: barriers to uptake and use.Aspects of Applied
Biology,72, pp.31-41.
-Simon, U., Brüggemann, R. andPudenz, S., 2004.Aspects of decisionsupport inwater
management—example Berlin and Potsdam (Germany) I—spatially differentiated
evaluation. Water Research,38(7), pp.1809-1816.
-Twomlow, S., Mugabe, F.T., Mwale, M., Delve, R., Nanja, D., Carberry, P. and Howden, M., 2008.
Building adaptive capacity to cope with increasing vulnerability due to climatic change in Africa–A
new approach. Physics and Chemistry of the Earth, Parts A/B/C,33(8-13), pp.780-787.
-Sebastian, K. ed., 2014. Atlas of African agriculture research and development: Revealing
agriculture's place in Africa. Intl Food Policy Res Inst.
5QUANTITATIVE MEASUREMENTS FOR MONITORING IMPACT
Initial site selection for the 2018 period is shown below (as reported in Deliverable 3)
Province
Site 1
Site 2
KZN
Bergville: Eibomvini,Thamela
(Mahlathini, GrainSA)
Estcourt: Thabamhlophe(Lima,
Mahlathini)
Limpopo
Hoedspruit: Sedawa, Turkey (Mahlathini,
AWARD)
Tzaneen: Sekororo (Lima,
Mahlathini)
EC
Fort Cox: Imvutho Buboni Learning
Network (Amanzi for Food, Mahlathini)
The table below outlines the sites selected for both dry land farming and vegetable gardening farmer
level experimentationin KZN and Limpopo. Conservation Agriculture (CA) plots in KZN wereplanted
in the last week of Novemberwhile the ones in Limpopowere plantedin early to mid-December2017.
The results for the experimentation process in Limpopo were report on the in Deliverable 5
Table 14: Participants in quantitative measurements for trials; KZN and Limpopo
Province
Category
Name of participants
Name of village
Date of planting
Limpopo
Field
cropping
Koko Maphori
Sedawa
05/12/2017
Moruti Sekgobela
Mametja
06/12/2017
Mariam Malepe
Botshabelo
07/12/2017
Gardening
Christinah Tobetjane
Sedawa
April-Aug 2018
Norah Malepe
Mametja
April-Aug 2018
Mariam Malepe
Botshabelo
April -Aug 2018
KwaZulu-
Natal
Field
cropping
Ntombake Zikode
Eqeleni
20-24 Nov 2017
Phumelele Hlongwane
Ezimbomzini
20-24 Nov 2017

WRC K4/2719 Deliverable 5: Interim report; Refined decision support system for smallholder CSA-October 2018
99
Phumzile Zimba
Mhlwazini
20-24 Nov 2017
Gardening
Smephi Hlatswayo
Eqeleni
June-Sept 2018
Phumelele Hlongwane
Ezibomvini
June-Sept 2018
Table 15: Measurements taken for the gardening trials
Parameter
Instruments
Dates
Evapotranspiration (Et0)
Davis weather station
ongoing
Soil moisture
Chameleon water sensors
On going
Amount of water applied
Measuring cylinder
On going
Rainfall
Rain gauge
On going
Weighing of the harvest
Weighing scale
On going
Rand value of the harvest
Local market price
At harvest
Table 16: Measurements taken for the field cropping trials
Parameter
Instruments
Dates
Evapotranspiration (Et0)
Davis weather station
ongoing
Soil moisture
Gravimetric soil water samples
4x in growing season
Bulk density
Sampling
Once towards the end of the
season
Soil fertility
Sampling for analysis at
CEDARA soil Lab
End of growing season
Soil health
Sampling for analysis by Soil
Health Solutions
End of growing seaosn
Rainfall
Rain gauges installed in 5 sites
On going
Infiltration
Single and double ring
infiltrometers
Once during the season
Run-off
Run-off plots installed in three
sites
On going
Weighing of the harvest
Weighing scale, including grain
and biomass (lab analysis)
At the end of the growing
season- for Mazie only
Rand value of the harvest
Local market price
At harvest
Measurements report Bergville (KZN)
Visual/ Qualitative Assessments
Written by Nonkanyiso Zondi and Erna Kruger
This methodology has beentried each year in the Bergville area, as a potential peer review system for
assessing soil quality. Below is the scoring sheet that has been designed for this assessment. This
assessment has been altered slightly in terms of indicators used when compared to similar processes

WRC K4/2719 Deliverable 5: Interim report; Refined decision support system for smallholder CSA-October 2018
100
employed
12
, to accommodate for tests that are seen to be very similar in the original forms. An
example is surface pondingand infiltration, which in our version hasbeen changed to infiltration only.
Table 17: VSA Indicator sheet
Visual indicator of
Soil Quality
Visual Score
(VS)
Weight
Comments
Soil Structure
(aggregates)
0 = Poor
conditions
1 = Moderate
conditions
2 = Good
conditions
3
Shatter test andassessment of clods for
distribution of aggregated 0=many large clods, few
smaller ones, 1=equal proportions of large and
finer aggregates, 2= larger proportion of friable soil
and fine aggregated
Soil porosity
3
0=hard compact clods, 1= breakable clods, 2= easily
breakable with organic matter and some roots
Soil colour and
organic matter
2
Here the organic matter is whatcounts.
0=none,1=little, 2=Some to lots
Number andcolour of
soil mottles
1
0= many mottles, 1=some mottles, 2= no mottles
Earthworm counts
2
As per manual
Soil cover(residue
cover)
2
As per manual
Soil depth (presence
of a tillage pan), depth
of rod into soil
2
0=0-10cm, 1=10-15cm, 2=>15cm
Run-off
2
As per manual
Infiltration (surface
ponding)
x 2
0= evidence of ponding (yellowing plants, standing
water after rain), 1= some ponding (water takes a
while to infiltrate) 2=no ponding
TOTAL
37
VSAs were conducted for 13 of the longer-term participants this season. Soil fromthe CA trial plots
were compared with the control plots. As is the case with a number of other indicators, the value of
comparing trials and controls has been minimised due to the fact that all these participants started
using CA in their control plots as well. There are however still marked differences in crop diversification
between the trial and control plots, as all participants plant only maize in their controls.
Below is a summary table for the soil-based indicators of the VSAs for the 13 participants.
1
Sheperd G. 2010. Visual Soil Assessment Field Guide: Part 1: Maize. FAO, Rome
2
Sheperd G, Bailey J, Johnson P. 2012. Visual Soil Assessment. SMI and Vaderstad. New Zealand.
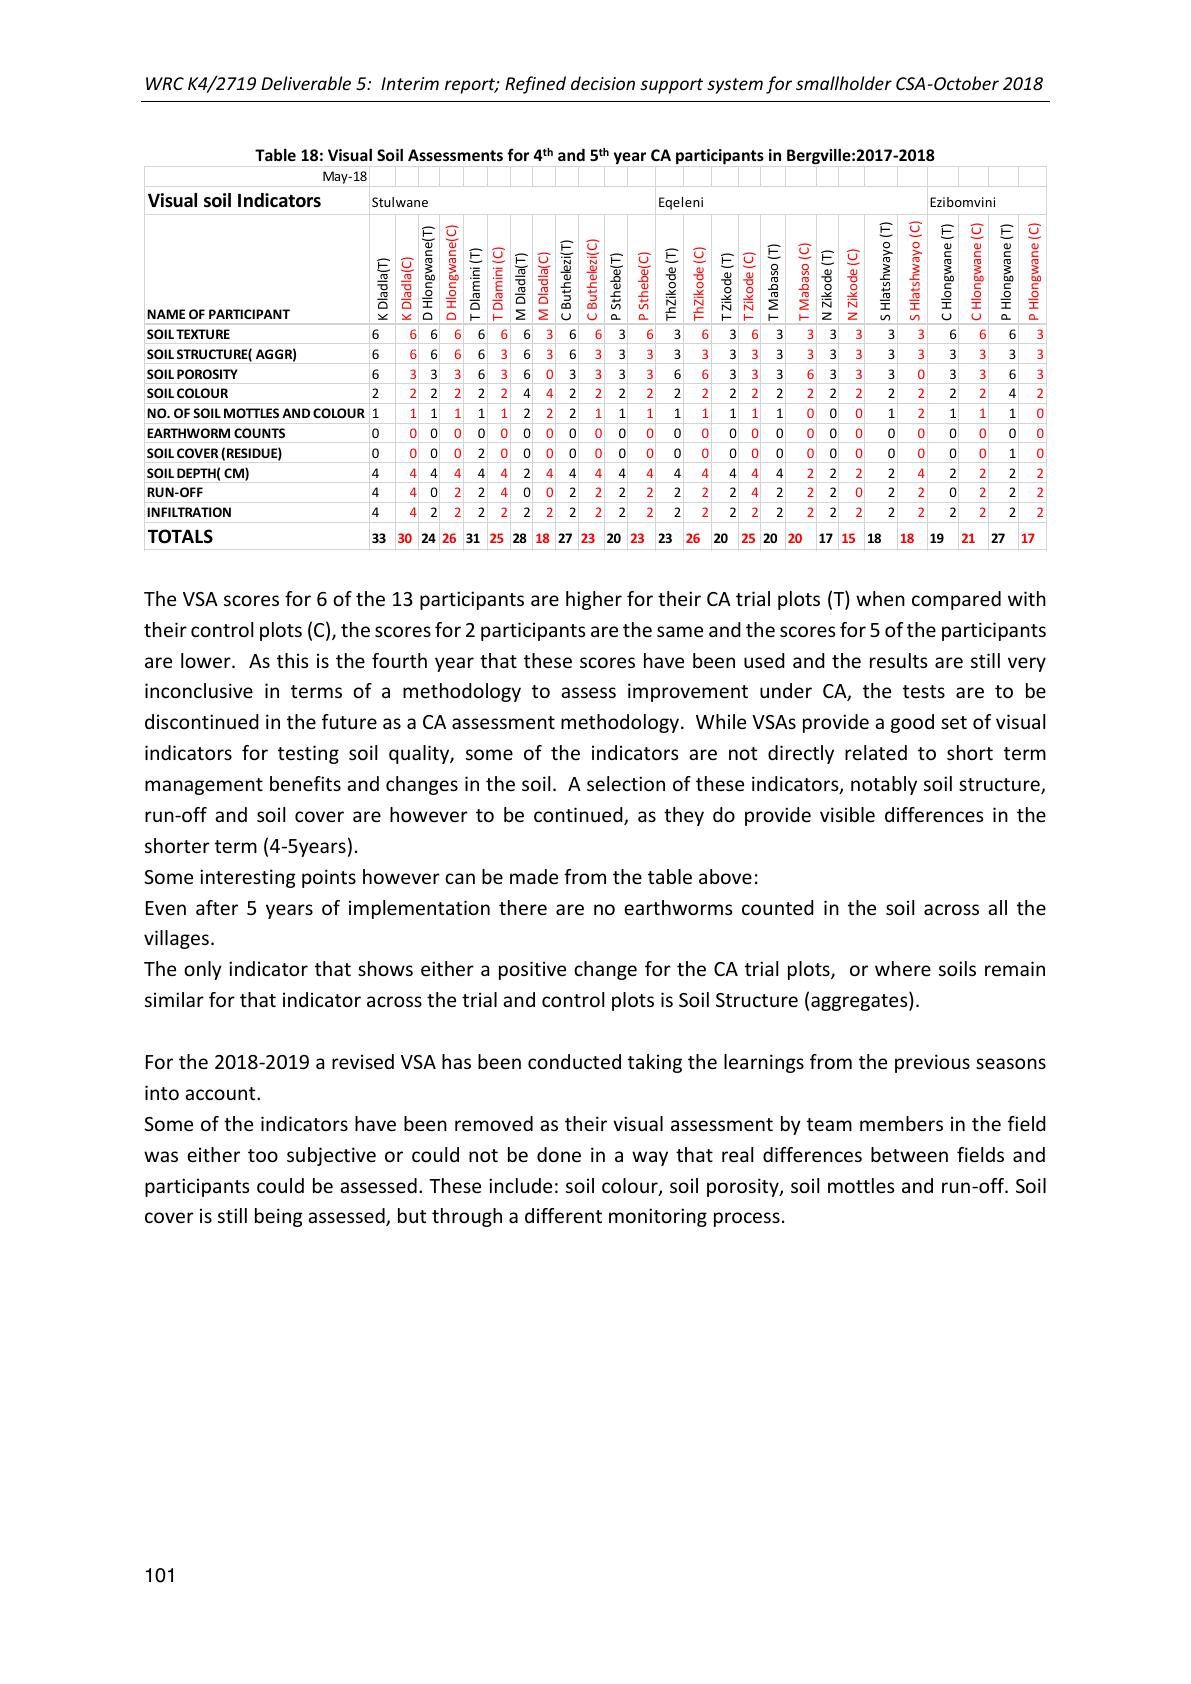
WRC K4/2719 Deliverable 5: Interim report; Refined decision support system for smallholder CSA-October 2018
101
Table 18: Visual Soil Assessments for 4th and 5th year CA participants in Bergville:2017-2018
The VSA scores for 6 of the 13 participants are higher for their CA trial plots(T) when compared with
their control plots(C), the scores for 2 participants are the same and the scores for 5 of the participants
are lower. As this is the fourth year that these scores have been used and the results are still very
inconclusive in terms of a methodology to assess improvement under CA, the tests are to be
discontinued in the future as a CA assessment methodology. While VSAs provide a good set of visual
indicators fortesting soil quality, some of the indicators are not directly related to shortterm
management benefits and changes in the soil. A selection of these indicators, notably soil structure,
run-off and soil cover are however to be continued, as they do provide visible differencesin the
shorter term (4-5years).
Some interesting points however can be made from the table above:
Even after 5 years of implementation there are no earthworms counted in the soil acrossall the
villages.
The only indicator that shows either a positive changefor the CA trial plots, orwhere soils remain
similar for that indicator across the trial and control plots is Soil Structure (aggregates).
For the 2018-2019 a revised VSA has been conducted taking the learnings from the previous seasons
into account.
Some of the indicators have been removed as their visual assessment by team members in the field
was either too subjective or could not be done in a way that real differencesbetween fields and
participants could be assessed. These include: soil colour, soil porosity, soil mottles and run-off. Soil
cover is still being assessed, but through a different monitoring process.
May-18
Visual soil Indicators
NAME OF PARTICIPANT
K Dladla(T)
K Dladla(C)
D Hlongwane(T)
D Hlongwane(C)
T Dlamini(T)
T Dlamini(C)
M Dladla(T)
M Dladla(C)
C Buthelezi(T)
C Buthelezi(C)
P Sthebe(T)
P Sthebe(C)
ThZikode (T)
ThZikode (C)
T Zikode (T)
T Zikode (C)
T Mabaso (T)
T Mabaso (C)
N Zikode (T)
N Zikode (C)
S Hlatshwayo (T)
S Hlatshwayo (C)
C Hlongwane (T)
C Hlongwane (C)
P Hlongwane (T)
P Hlongwane (C)
SOILTEXTURE66666663663 6 3 6 36333333666 3
SOILSTRUCTURE( AGGR)66666363633 3 3 3 33333333333 3
SOILPOROSITY63336360333 3 6 6 33363330336 3
SOILCOLOUR22222244222 2 2 2 22222222224 2
NO. OF SOIL MOTTLES ANDCOLOUR11111122211 1 1 1 11100012111 0
EARTHWORM COUNTS00000000000 0 0 0 00000000000 0
SOILCOVER(RESIDUE)00002000000 0 0 0 00000000001 0
SOILDEPTH( CM)44444424444 4 4 4 44422224222 2
RUN-OFF 44022400222 2 2 2 24222022022 2
INFILTRATION 44222222222 2 2 2 22222222222 2
TOTALS 333024263125 28 18 27 23202323262025202017 15181819212717
Stulwane
Eqeleni
Ezibomvini
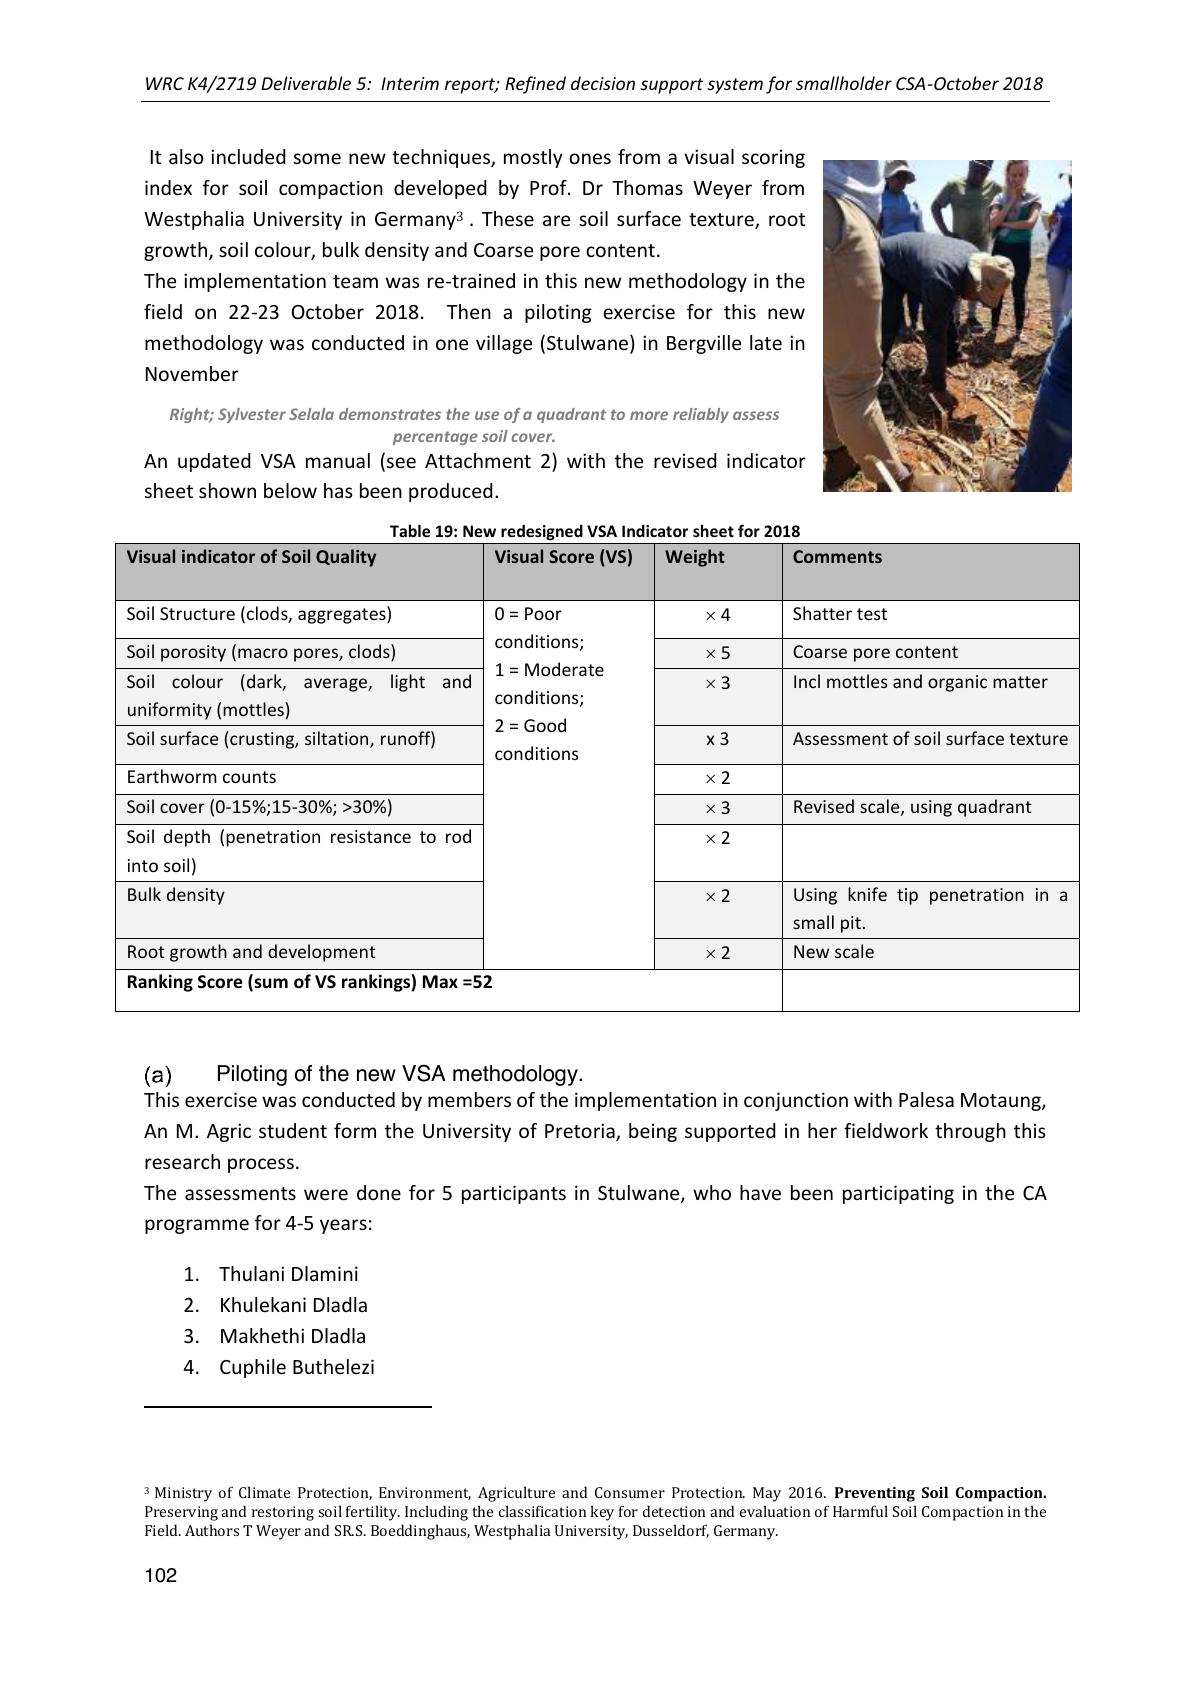
WRC K4/2719 Deliverable 5: Interim report; Refined decision support system for smallholder CSA-October 2018
102
It also included some new techniques, mostly ones from a visual scoring
index for soil compaction developed by Prof. Dr Thomas Weyer from
Westphalia University in Germany
3
. These are soilsurface texture, root
growth, soil colour, bulk density and Coarse pore content.
The implementation team was re-trained in this new methodology in the
field on 22-23 October 2018. Then a piloting exercise for this new
methodology was conducted in one village (Stulwane) in Bergville late in
November
Right; Sylvester Selala demonstrates the use of a quadrant to more reliably assess
percentage soil cover.
An updated VSA manual (see Attachment2) with the revised indicator
sheet shown below has been produced.
Table 19: New redesigned VSA Indicator sheet for 2018
Visual indicator of Soil Quality
Visual Score (VS)
Weight
Comments
Soil Structure (clods, aggregates)
0 = Poor
conditions;
1 = Moderate
conditions;
2 = Good
conditions
4
Shatter test
Soil porosity (macro pores, clods)
5
Coarse pore content
Soil colour (dark, average, light and
uniformity (mottles)
3
Incl mottles and organic matter
Soil surface (crusting, siltation, runoff)
x 3
Assessment of soil surface texture
Earthworm counts
2
Soil cover (0-15%;15-30%; >30%)
3
Revised scale, using quadrant
Soil depth (penetration resistance to rod
into soil)
2
Bulk density
2
Using knife tip penetration in a
small pit.
Root growth and development
2
New scale
Ranking Score (sum of VS rankings) Max =52
Piloting of the new VSA methodology.
This exercise was conducted by members of the implementation in conjunction with Palesa Motaung,
An M. Agric student form the University of Pretoria, being supported in her fieldwork through this
research process.
The assessments were done for 5 participants in Stulwane, who have been participating in the CA
programme for 4-5 years:
1. Thulani Dlamini
2. Khulekani Dladla
3. Makhethi Dladla
4. Cuphile Buthelezi
3
Ministry of Climate Protection, Environment, Agriculture and Consumer Protection. May 2016. Preventing Soil Compaction.
Preserving and restoring soil fertility. Including the classification key for detection and evaluation of Harmful Soil Compaction in the
Field. Authors T Weyer and SR.S. Boeddinghaus, Westphalia University, Dusseldorf, Germany.

WRC K4/2719 Deliverable 5: Interim report; Refined decision support system for smallholder CSA-October 2018
103
5. Mtholeni Buthelezi
Below are a few photographs indicative of the VS assessment and sampling process
Above Left-Right: Doing the bulk density test using a knife blade. A clod of earth showing good aggregation, organic
matter and fine root system. A soil sausage showing the high clay content of the soil.
Above left to right: Examples of the shatter test for soil structure –showing good soil structure; with porous loos soil
with irregular aggregates of a dark colour indicate of higher organic matter –an intermediate or moderate soil structure
–With a larger proportion of clods that break up into unaggregated soil, but also larger clods staying intact and Poor
Soil structure with a large clod showing very little root penetration and few macro pores.
The small table below summarises the new VSA methodology results for the five participants. This
approach appears to be a lot more promising and will be furtherexplored during this growing season.
An important consideration, not taken into account previously is that the soils have to be moist when
these tests are conducted. Dry soils and especially those in higher clay soils will show “signs” of
compaction under dry conditions, regardless of the condition of the soil.

WRC K4/2719 Deliverable 5: Interim report; Refined decision support system for smallholder CSA-October 2018
104
Table 20: VSA scores using the new methodology for 5 participants in Stulwane, November 2018.
The veld samples are considered tobe high benchmarks to compare the cropping plots against.
Sampled plots (from the CA trial plots) were two maize only plots and two maize and beans plots for
each participant. From the table above the following observations can be made:
The score ranges are:
Visual Soil Quality Assessment
Ranking score
Poor
0-20
Moderate
21-35
Good
36-52
•For the veld samples, even though they are meant to be high benchmarks only 3 of the 5
samples can be considered good under the VS assessment. This means that soil conditions
generally in the Bergville area tend towards compaction, lack of soil aggregation and low to
medium organic matter, even in undisturbed soils.
•The farmer who has been the most successful in changing his soils for the better through his
CA implementation is Kulekani Dladla, where the results for both his CA Maize only and CA
maize and bean intercropped plots are higher than the veld benchmark, although the overall
rating is still considered as moderate. In real terms this is a significant outcome- being able
to improve soils’ health and structure above that of the surrounding veld.
•For three of the five farmers their VS assessment is higher for their CA maize plots than their
CA Maize and Bean intercropped plots.
•Soil characteristics that gave similar scores across the different farmers and plots are soil
surface texture and soil depth. This points towards the general compaction of soils in the
area and slow build -up of organic matter, even in the CA plots.
•Soil characteristics that differed between farmers and their different trial plots include soil
structure (aggregates), soil porosity and bulk density. This indicates that these soil
characteristics are being affected positively through the CA cropping practices.
•There were zero earthworm counts throughout the whole system, including the veld plots.
The re-orientedVSA process is much more able to provide a qualitativeassessmentof individual’s
fields and the effect of their cropping practices on their soil characteristics.
VSA Score
Name and Surname
CA Maize
CA Maize + Beans
Veld
Mthuleni Dlamini
40
24,5
41
Khulekani Ddladla
34,5
31,5
27
Makhethi Dladla
25
33
34
Cuphile Buthelezi
28
30
37
Thulani Dlamini
31
26,5
39

WRC K4/2719 Deliverable 5: Interim report; Refined decision support system for smallholder CSA-October 2018
105
Quantitative assessments/ measurements
Written by Sylvester Selala
Most of the informationwas meant to go into an AquaCrop model, a crop growth model developed
by FAO to assessthe effect of environment and the management on crop production as well as
addressing food security. The model uses climatic variables (rainfall, air temperature, relative
humidity, solar radiation, wind speed and direction) and environmental variables (soil characteristic
which includes, soil structure, Bulk density, soil texture, as well as crop data).
The model is more suitable for simulating crop growth in mono-cropped fields,even though under
conservation agriculture (CA), multiple cropping is highly promoted. We have chosen to focus on the
primary crop (maize) and did not include the secondary crop (dry bean, cowpea and cover crops)
One-year datarecords are usually not enough to run a model, but data collectionwas conducted to
build on.
Approaches and methodology
A number of different measurements have been proposed to go alongside visual indicators, both as
benchmarks and potentially to serve as proxies for some of the indicators being observed.
The intention is to create a process/methodology primarily of visual assessments, benchmarked with
some scientific measurements as a means to assess impact of climate smart agriculture practices in a
participatory manner with farmers. Below, an outline of each methods is provided with some
comments on the implementation of that methods, followed by this season’s results and some
analysis.
Rainfall
In the light of climate change, studies have shown the importance of the need for routine
dissemination of climatic information which serves as a guide to improving the local agricultural
decision making. Establishment of community agrotechnological participatory extension strategies is
needed to ensure sustainability of routine dissemination of climatic information. The first step
towardsbuilding a routine dissemination of climatic data, is capacity building on how to collect and
use climatic information at community level. Rainfall is one of the climatic factors (easy to measure)
which hugely affect agricultural production, especially in rainfed field cropping systems. Through the
WRC and farmers innovation developmentprogramme we have introduced farmers to collecting
rainfall data from standard rain gauges installed in their homesteads.
Rain gauges have been installed across 5 villages (Ezibomvini, Eqeleni, Thamela, Stulwane and
Ndunwana). Some of the rainfall data is collected using a tippingbucket method from the Davis
weather station installed at Ezimbomvinivillage.Data sheets are provided to the farmers to record
the rainfall data on. Rainfall readings are taken in the mornings
Challenges
-Time of taking rainfall readings (rainfall readings are takenat different times each day and
sometime are taken after mid- day when some evaporation has taken place)
-Systematic errors
-Random errors
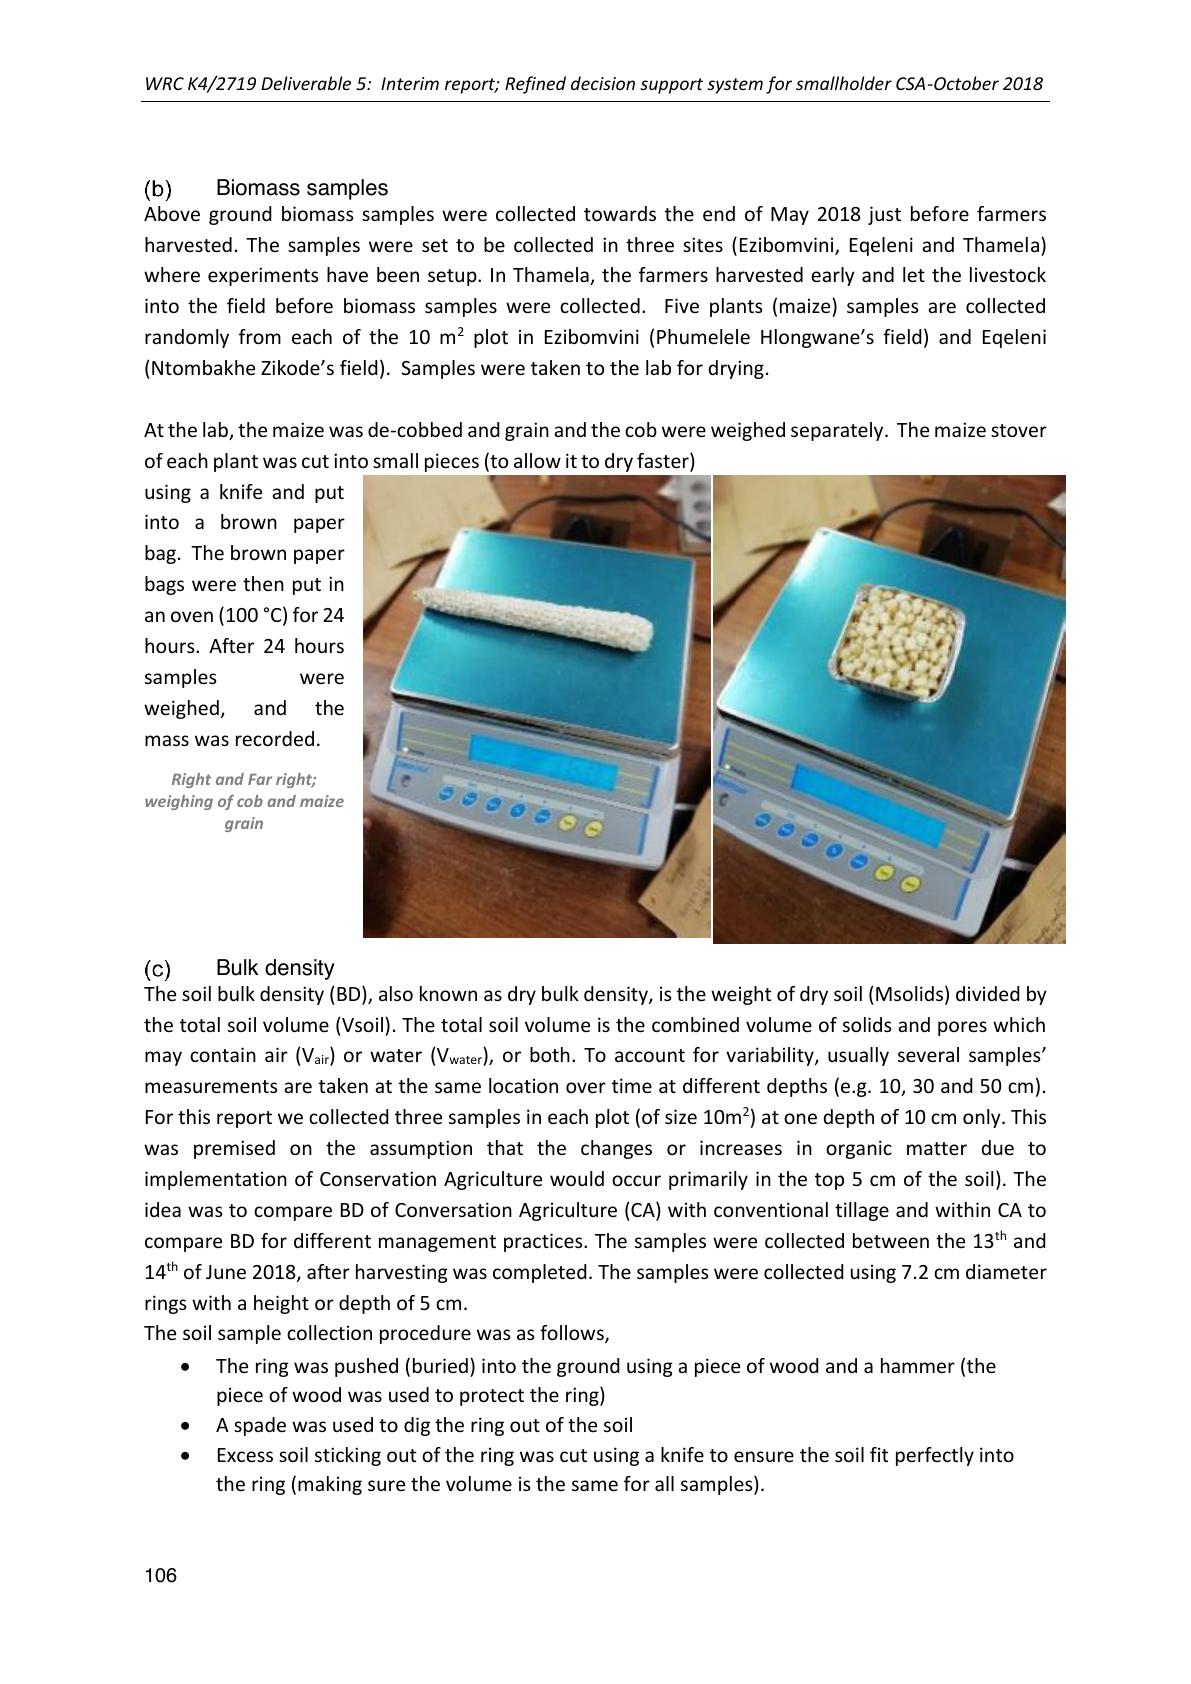
WRC K4/2719 Deliverable 5: Interim report; Refined decision support system for smallholder CSA-October 2018
106
Biomass samples
Above groundbiomass samples were collected towards the end of May 2018 just before farmers
harvested. The samples were set to be collected in three sites (Ezibomvini, Eqeleni and Thamela)
where experiments have been setup. In Thamela, the farmers harvested early and let the livestock
into the field before biomass samples were collected. Five plants (maize) samples are collected
randomly from each of the 10 m2plot in Ezibomvini(Phumelele Hlongwane’s field) and Eqeleni
(Ntombakhe Zikode’s field). Samples were taken to the lab for drying.
At the lab, the maize was de-cobbed and grain and the cobwere weighed separately. The maize stover
of each plant was cut intosmall pieces (to allow it to dry faster)
using a knife and put
into a brown paper
bag. The brown paper
bags were then put in
an oven (100 °C) for 24
hours. After 24 hours
samples were
weighed, and the
mass was recorded.
Right and Far right;
weighing of cob and maize
grain
Bulk density
The soil bulkdensity (BD), also known as dry bulk density, is the weight of dry soil (Msolids) divided by
the total soil volume (Vsoil). The total soil volume is the combined volume of solids and pores which
may contain air (Vair) or water (Vwater), or both.To account for variability, usually several samples’
measurements are taken at the same location over time at different depths (e.g.10, 30 and 50 cm).
For this report we collected three samples in each plot (of size 10m2) at one depth of 10 cm only.This
was premised on the assumptionthat the changes or increasesin organicmatter due to
implementationof Conservation Agriculture would occur primarily in the top 5 cmof the soil). The
idea was to compare BD of Conversation Agriculture (CA) with conventional tillage and within CA to
compare BD for different management practices. The samples were collectedbetween the 13th and
14th of June 2018, after harvesting was completed. The samples were collected using 7.2 cm diameter
rings with a height or depth of 5 cm.
The soil sample collection procedure was as follows,
•The ring was pushed (buried) into the ground using a piece of wood and a hammer (the
piece of wood was used to protect the ring)
•A spade was used to dig the ring out of the soil
•Excess soil sticking out of the ring was cut using a knife to ensure the soil fit perfectly into
the ring (making sure the volume is the same for all samples).

WRC K4/2719 Deliverable 5: Interim report; Refined decision support system for smallholder CSA-October 2018
107
•The soil samples (in the ring) were wrapped with aluminium foil and transported to the lab
for analysis
•At the lab samples were unwrapped, placed in aluminium dishes, weighed and assigned
codes and put in an oven (at 100°C) for 48 hours to dry
•After 24 hours, samples were weighed, and the masses were recorded
•Then the fresh mass and the dry mass were used to calculate the bulk density
The equation used to calculate the total soil volume is as shown below.
(1)
Where, πis Pi and r is radius for the ring and d is depth of the ring and the volume was calculated in
cm3while the mass of the sample was measured in grams (g)
Average dry mass forall samples collected in the same plot was used in calculation the bulk density
and the same volume (based on the dimensions of the ring) was used. Equation 2 was used to
calculate the BD
(g/cm3) (2)
Above Left to right: Process for taking bulk density samples
Gravimetric water measurements (procedure)
Soil samples for analysis of gravimetric water content (in gram per gram)were collected at different
stages of crop development (planting, end of establishment, vegetative growth, tasselling, and
physiological maturity).These stages of cropdevelopment are shown in Figure 3 below. Three samples
per plot at each depth were collected at four depths (30, 60, 90 and 120 cm).

WRC K4/2719 Deliverable 5: Interim report; Refined decision support system for smallholder CSA-October 2018
108
Figure 12: Stage of crop development used as a guide for collection of samples for analysis of gravimetric water content
Closed and open bucket soil augers were used to collect the soil samples. Samples were collected into
zipper plastic bag to minimise or prevent loss of moisture from the soil sample. Samples were then
put in a cooler box and stored in a cool dry place before were sent to the lab for analysis. Larger
samples were mixed and subsampled in the lab(ensuring that all samples were almost the same size).
The soil samples were weighed for fresh or wet mass andput in an oven (at 100 °C) for 48 hours. After
48 hours the samples were weighed again and the dry mass was recorded.
In calculating gravimetric water content, equation 3 below was used:
Above Left to right: Process for analysis of gravimetric soil water smaples

WRC K4/2719 Deliverable 5: Interim report; Refined decision support system for smallholder CSA-October 2018
109
Infiltration measurements
Three different methods of measuring infiltration rateswere tested totry and find aneasymethod
which can be used by farmers. This was also meant to investigate the pattern in the measurements
made using each of the methods.
Method 1: This method uses a single ring infiltrometer with a known volume of water (1 litre). A thin
layer of plastic is laid inside the infiltrometer before pouring water and then removed once the water
has been poured in to ensure an even distribution of the water inside the ring. Once removed the stop
watch was started to time the infiltration rate. This procedure is repeated 4 times, the first reading is
discarded, and an average of the following three readings is used tocalculate the infiltration rate
(mm/hr).
Tools required:
•1 litre container or bottle
•A stopwatch
•A single ring
infiltrometer
(20 cm
diameter)
•Recording sheet
Right and Far right:
measuring infiltration using
a single ring infiltrometer
Method 2:This method uses a double ring infiltrometer (inner and outer) in measuring the infiltration
rate. Calibrations of 1 cm apart are made in the outer ring where readings are taken (time is recorded
after every 1 cm drop in the water level inside the outer ring). The inner ring is also filled with water
to promote more vertical movement of water from the outer ring into the soil.
Tools required:
•Double ring infiltrometer (inner ring 20 cm diameter and outer ring 60 cm diameter)
•Water
•A spirit level is used to ensure that the infiltrometer is level
•Hammer (to drive the infiltrometers into the ground)
•A stopwatch
The time intervals for every 1 cm drop in the water level is recorded and the difference between the
intervals is calculated. This process isrepeated until the difference in time intervals isalmost constant.
The infiltration rate is then calculated using the depth (worked out from the dimensions of an
infiltrometer) and the average time interval.

WRC K4/2719 Deliverable 5: Interim report; Refined decision support system for smallholder CSA-October 2018
110
Above Left to Right: Measuring infiltration rate using double ring infiltrometer
Method 3:Making a small pit with a spade of size 25 cm2to allow water to sit (the pit serves as an
infiltrometer). Like method one, a known volume of water (1 litter) is poured in the pit and the time
it takes to infiltrate that water is recorded.This process is repeated until the time it takes to infiltrate
the water is almost constant.
Tools required:
•A spade (to make the pit)
•Tape measure (to measure dimensions of the pit)
•Stopwatch
The infiltration rate is calculated in the same way as described in method two.
Above: Infiltration measurement using the third method

WRC K4/2719 Deliverable 5: Interim report; Refined decision support system for smallholder CSA-October 2018
111
Runoffmeasurements
Five 1m2runoff plots were installed in 5 plots of size 10 m2planted with different crops to investigate
the effect crop management on runoff generation for three sites in Bergville (Ezibomvini, Eqeleni and
Thamela). The runoff plots are connected to 25-litre collection buckets through a pipe. These buckets/
basinsare covered with lids, so that rain does not fall directly into these containers. In the current
design, the lids tend to be removed by the farmers and not replaced, leading to a potential over-
estimation of run-off.
During a rainfall event, water infiltrates the soil and excess water flows into the collection bucket as
runoff. The runoff plots are driven into the ground to ensure excess water only exits the runoff plot
through the hole connected to the pipe into the collection bucket. A spirt level was used to keep the
runoff plots levelled and the slope is considered (runoff plots were not installed on slopes higher that
7 %) when installing the runoff plots. Excess water generated from the runoff plots flows in to
collection basin which is part of or attached to the runoff plots. A data sheet is provided to the farmer
to collect runoff data, a day after a rainfall event.
Above: Runoff measurements and at village level
Water productivity
The main variables used in calculating water productivity (WP) are yields and volume of water used to
produce that particular yield. There are standard methods used in working out the yield (e.g. putting
the harvested grain or biomass on a scale and weighing it, weighing a sample of cobs for maize and

WRC K4/2719 Deliverable 5: Interim report; Refined decision support system for smallholder CSA-October 2018
112
estimating yield usingthe plant population). The challenge is in determining the volume of water used
to produce the yield. There are a couple of methods (simple and more complicated) used in
determining the volume of water used. We explored three of these methods in this report. Normally,
for maize only the grain yield is considered when calculating WP, for this repot we used both grain
yield and dry biomass.
Method 1: This method uses climatic information (solar radiation, air temperature, relative humidity,
wind speed and etc) to calculate reference evapotranspiration (ET0). From the Davis weather station
ET0is calculated of hourly time steps (the weather station automatically calculated the ET0). Due to a
faulty solar radiation measuring component of the weather station, the Davis weather station did not
generate ET0value. We then obtained solar radiation surrogate data from a South African
Environmental Observation Network (SAEON) weather station in Didima in the Drakensburg. The ET0
was calculated manually through a series of formulas shown below.
After obtaining the ET0values, they are then multiplied by the crop coefficient to find the actual
evapotranspiration (Etc), which is the volume of water used to produce the yield.
Method 2:This method uses the water balance equation to derive the ET0and this is calculated for
growing season.
Where p=precipitation, R=runoff, = change in soil water content, D= deep percolation and ET0
=reference evapotranspiration.
Here the gravimetric soil water results were used.
Method 3: This is a simple method which required only one variable (rainfall) which famers find easy
to measure. The main assumption hear is that, all water (in the form of rainfall orirrigation)
contributes to plant growth and to producing yield. Therefore, precipitation becomes the volume of
water used to produce a yield in a dryland cropping situation and rainfall plus water applied is used in
irrigated situation
Results and discussion
Written by Erna Kruger
Results (bulk density)
*Note; This section was reported in deliverable 5 and are included here for completion sake
Soil tillage has been a popular agricultural practise throughout the world due to the initial
improvement of crop productivity, control of weeds and ease with which crops can be planted.
However, it has been recognised in many regions that this improved productivity is temporary and
overall, soil organic matter (SOM) content decreases under conventional tillage (CT).
This decrease in SOM results in a decline of soil quality as SOM plays a major role in the soil’s structural
and pore characteristics by influencing aggregate stability.
Bulk density samples were taken for three participants, towards the endof the cropping season (early
May 2018). Samples were taken this late in the season as many authors report greater porosity, lower
ρb and reduced soil strength under CT than under (no-till) NT due to the creation of macro-pores

WRC K4/2719 Deliverable 5: Interim report; Refined decision support system for smallholder CSA-October 2018
113
during ploughing. These provide for a lower ρbreading early in theseason, as during the course of the
season the soil settles again and the readings increase (Basset, 2010)
4
.
Belowis a summary of the results of the bulk density calculations for different cropping practices
within the CA system of the three participants. They were chosen for having differingperiod of
cropping under CA and for inclusion of a number of practices within their CA system; namely
intercropping and planting of summer cover crops (SCC).
Table 21: Bulk density results for three CA participants
Village
Period
under CA
(yrs)
Name and
Surname
Control CT
Control CA
M
M+B
M+CP
SCC
Average
Ezibomvini
4
Phumelele Hlongwane
1,30
1,36
1,38
1,33
1,38
1,28
1,34
Eqeleni
5
Ntombakhe Zikode
1,35
1,49
1,37
1,32
1,38
Thamela
1
Mkhuliseni Zwane
1,14
1,08
1,09
1,07
1,10
Average bulk density
1,27
These results indicate an increase in ρb over period of involvementin CA. There is little to no difference
between the CA practices, although in all three cases the planting of SCC has reduced the ρb
fractionally.
An explanation for this trendis that ploughing increases the presence of macro-pores in the short
term but, less structural stability under CT can lead to lower porosity, higher bulkdensities and greater
soil strength with time, as tillage-induced pores readily collapse. Although initial conversion from CT
to CA usually results in higher bulk densities it is unlikely that plant growth will suffer markedly as a
consequence of insufficient moisture and poor aeration status. Improved aggregation and pore
connectivity under CA allows the soil to maintain an adequate supply of moisture and air (Cavalieri et
al., 2009)
5
.
The average ρb of 1,3g/cm3is to be used for the water productivity calculations
Results (rainfall data)
Rain gauges were installed across 5 villages in the Bergville area. The rain gauges installed previously
(2016-2017) in Okhombe and Emangweni were moved to other villages, as the participants there were
not meticulous about taking the rainfall records. For the most part, rainfall records this season were
not very well kept and only a generalised analysis of rainfall has been possible.
Below is a small table that summarises the information. The cumulative average rainfall for the area
as recorded by the farmers was 563 mm between December2017-May 2018.
4
Basset, T.S. 2010. A comparison of the effects of tillage on Soil physical properties and microbial
Activity at different levels of nitrogen Fertilizer at Gourton farm, Loskop, Kwazulu-Natal. MSC thesis. Dept of Soil Science,
UKZN.
5
Cavalieri K.M.V., da Silva A.P., Tormena C.A., Leão T.P., Dexter A.R. and Håkansson I., 2009.
Long-term effects of no-tillage on soil physical properties in a Rhodic Ferrasol in Paraná,
Brazil. Soil and Tillage Research, 103 (158-164).

WRC K4/2719 Deliverable 5: Interim report; Refined decision support system for smallholder CSA-October 2018
114
Averages for Ezibomvini, Eqeleni,
Stulwane, Thamela and Ndunwana
Dec
Jan
Feb
March
April
May
Monthly rainfall (mm)
185
72,25
169,2
114,7
17
5
Mean (mm) per rainfall event
7,9
5,8
8,2
7,6
2,1
0,4
Max (mm) per rainfall event
60
30
30
20
1
3,5
An analysis of the rainfall patterns for January-February 2018 were done for Ndunwana as an example
of the rainfall distribution in these months.
Figure 13: rainfall data for Ndunwana for December 2017-January 2018
A few observations can be made from the two small graphs above:
•The number of rainfall events in December was 13 and in January 7
•In each month one large rainfall event occurred; 60mm in December and 30mm in January
•The average rainfall per event for December was 6mm and for January was 2,2mm
This indicates a high variability in rainfall with extreme events punctuated by small amounts of rain
which were unevenly distributed. This dry spell in the period of maturation of beans and maize have
had a detrimental effect on yields –more specifically for the beans.
For the coming season a process of much more close monitoringof data recording by the
implementation team and a research intern to be employed, will be undertaken.
Results (runoff)
For most households the taking of runoff measurements was given to teenagers living in the
homestead as their responsibility. The reasoningwas that these teenagers,being in high school are
the more literate members of the household and are also the most available on an ongoing basis as
they do not travel. We also thought it would be an interesting exercise for them.
However, these assumptions did not hold as the teenagers tended to lose focus and forget about
checking the runoff plots, especially after long periods without rain. They also did not check the plots
meticulously after eachrainfall event, so that even where runoff data was recorded it stretchedacross
a few events –Data for this season are thus rather sparse.
A decision was made for the coming season to include both interns and postgraduate students into
this process to ensure better recording of events. In addition, the runoff plots are now installed in the
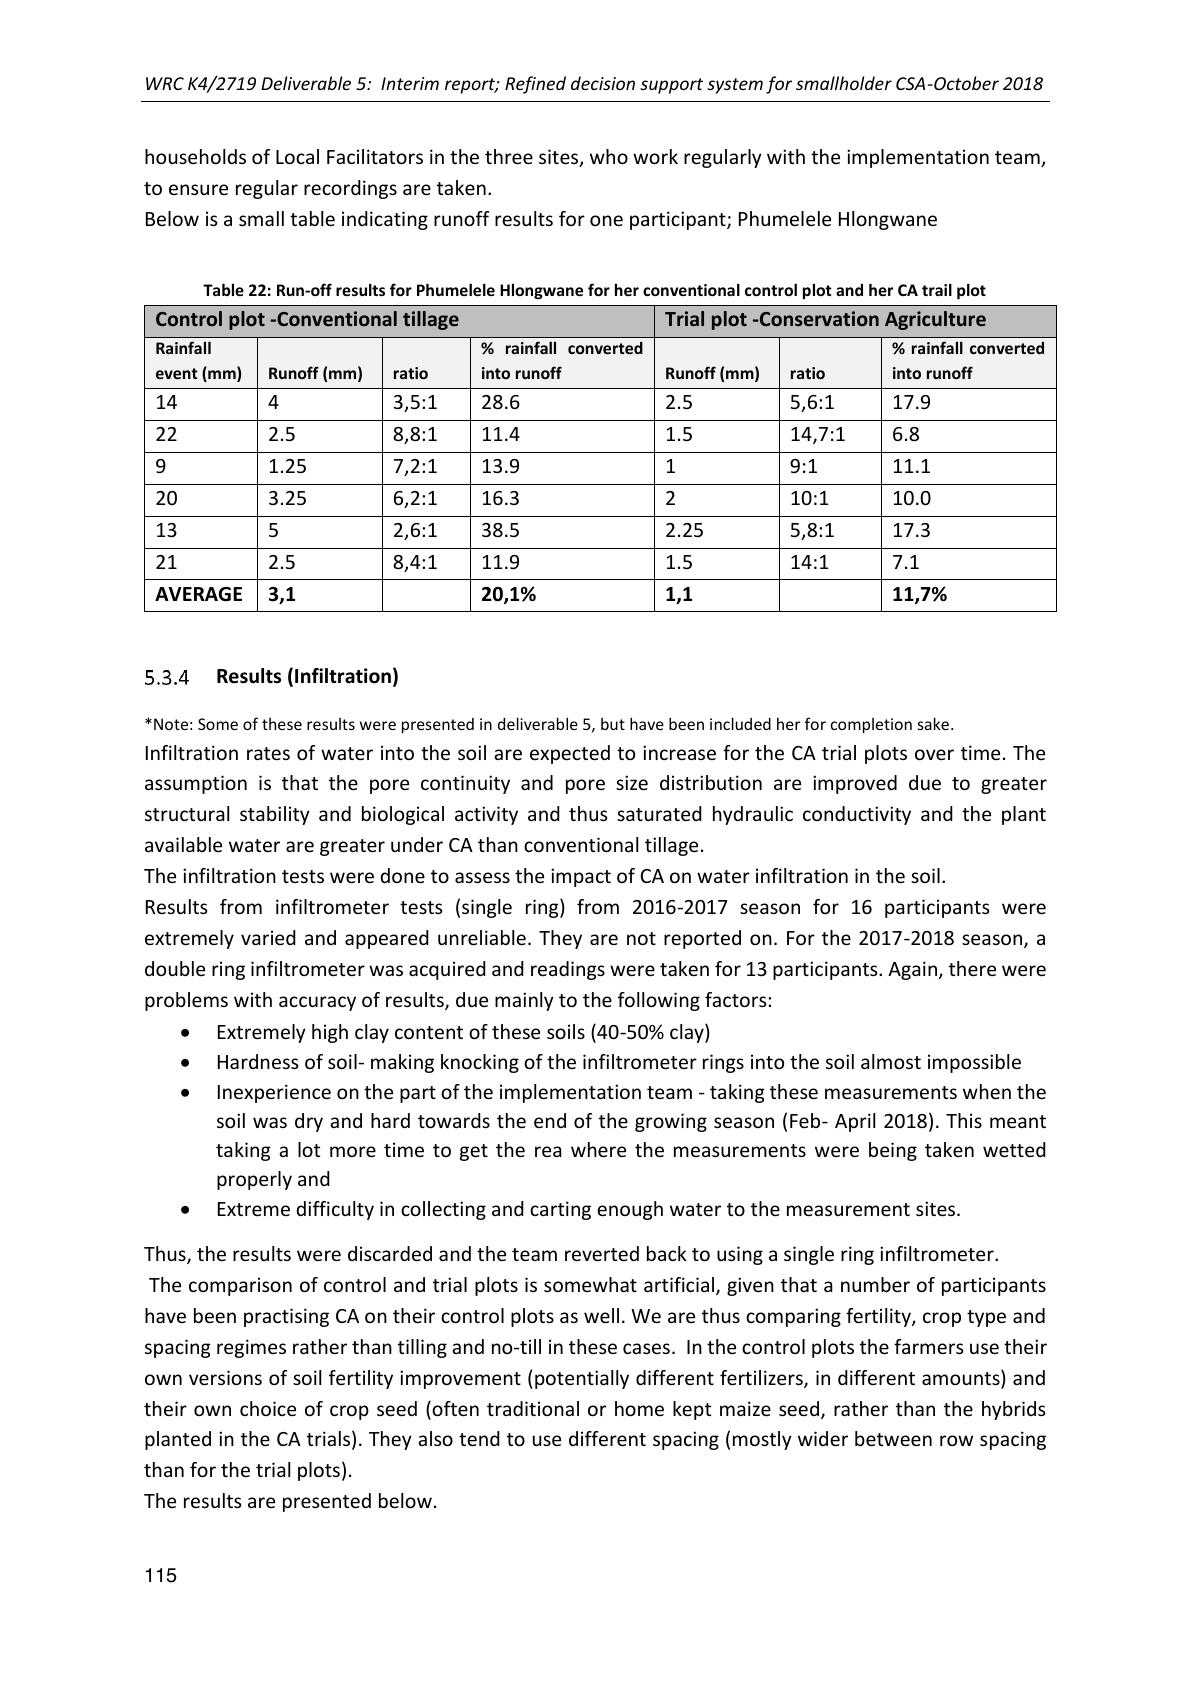
WRC K4/2719 Deliverable 5: Interim report; Refined decision support system for smallholder CSA-October 2018
115
households of Local Facilitators in the three sites, who work regularly with the implementation team,
to ensure regular recordings are taken.
Below is a small table indicating runoff results for one participant; Phumelele Hlongwane
Table 22: Run-off results for Phumelele Hlongwane for her conventional control plot and her CA trail plot
Results (Infiltration)
*Note: Some of these results were presented in deliverable 5, but have been included her for completion sake.
Infiltration rates of water into the soil are expected to increase for the CA trial plots over time. The
assumption is that the pore continuity and pore size distribution are improved due to greater
structural stability and biological activity and thus saturated hydraulic conductivity and the plant
available water are greater under CA than conventional tillage.
The infiltration tests were done to assess the impact of CA on water infiltration in the soil.
Results from infiltrometertests (single ring) from 2016-2017 season for 16 participants were
extremely varied and appeared unreliable. They are not reported on. For the 2017-2018 season, a
double ring infiltrometer was acquired and readings were taken for 13 participants. Again, therewere
problems with accuracy of results, due mainly to the following factors:
•Extremely high clay content of these soils (40-50% clay)
•Hardness of soil- making knocking of the infiltrometer rings into the soil almost impossible
•Inexperience on the part of the implementation team -taking these measurements when the
soil was dry and hard towards the end of the growing season (Feb-April 2018). This meant
taking a lot more time to get the rea where the measurements were being taken wetted
properly and
•Extreme difficulty in collecting and carting enough water to the measurement sites.
Thus, the results were discarded and the team reverted back to using a single ring infiltrometer.
The comparison of control and trial plots is somewhat artificial, given that a number of participants
have been practising CA on their control plots as well. We are thus comparing fertility, crop type and
spacing regimes rather than tilling and no-till in these cases. In the control plots the farmers use their
own versions of soil fertility improvement (potentially different fertilizers, in different amounts) and
their own choice of crop seed (often traditional or home kept maize seed, rather than the hybrids
planted in the CA trials). They also tend to use different spacing (mostly wider between row spacing
than for the trial plots).
The results are presented below.
Control plot -Conventional tillage
Trial plot -Conservation Agriculture
Rainfall
event (mm)
Runoff (mm)
ratio
% rainfall converted
into runoff
Runoff (mm)
ratio
% rainfall converted
into runoff
14
4
3,5:1
28.6
2.5
5,6:1
17.9
22
2.5
8,8:1
11.4
1.5
14,7:1
6.8
9
1.25
7,2:1
13.9
1
9:1
11.1
20
3.25
6,2:1
16.3
2
10:1
10.0
13
5
2,6:1
38.5
2.25
5,8:1
17.3
21
2.5
8,4:1
11.9
1.5
14:1
7.1
AVERAGE
3,1
20,1%
1,1
11,7%

WRC K4/2719 Deliverable 5: Interim report; Refined decision support system for smallholder CSA-October 2018
116
Table 23: Summary of water infiltration results for 13 participants in Bergville; 2017-2018
Village
Name and Surname
Yrs under
CA
infiltration rate
(mm/hr) control
infiltration
rate (mm/hr)
trial
Stulwane
Khulekani Dladla
5
587,4
531,4
Dlezakhe Hlongwane
5
226,2
423,8
Thulani Dlamini
5
422,7
450,0
Makhethi Dladla
5
226,6
587,4
Pasazile Sithebe
5
544,4
478,3
Cuphile Buthelezi
5
429,2
637,7
Ezibomvini
Phumelele Hlongwane
4
455,5
282,5
Cabangile Hlongwane
3
183,0
133,9
Eqeleni
Tholwephi Mabaso
5
218,8
250,8
Tombi Zikode
5
618,1
177,1
Smephi Hlatshwayo
5
434,8
218,8
In summary, infiltration results were higher and thus faster for the CA plots for only 5 of the 13
participants. Generally, soils are hard, with high clay content and a lot of compaction and soil crusting
is still visible, in both the control and CA plots. The intention has been to use these infiltration results
as one of the proxies for determination of improvement of soil structure through implementation of
CA. However, structural improvements in the soil cannot be gauged using water infiltration as a proxy
as there are too many other variables and parameters to also consider.
Results for Phumelele Hlongwane
Right: the infiltrometer ring being used in one of
Phumelele’s trial plots
The infiltration measurements were collected
on 2 consecutive days following the same
method. A single ring (core ring) was used and it
was levelled using a spirit level and placed in the
middle of each plot at a point most
representative of the whole plot. A 1 l bottle was
used to add water into the infiltrometer. With a
known volume of water added at a given time,
the following equation was used to calculate the
infiltration rate;
Making the depth a subject of the formula
Therefore
(2)
Then the calculated depth was 31.85 mm and the only variable was time taken to infiltrate 31.85 mm
of water.
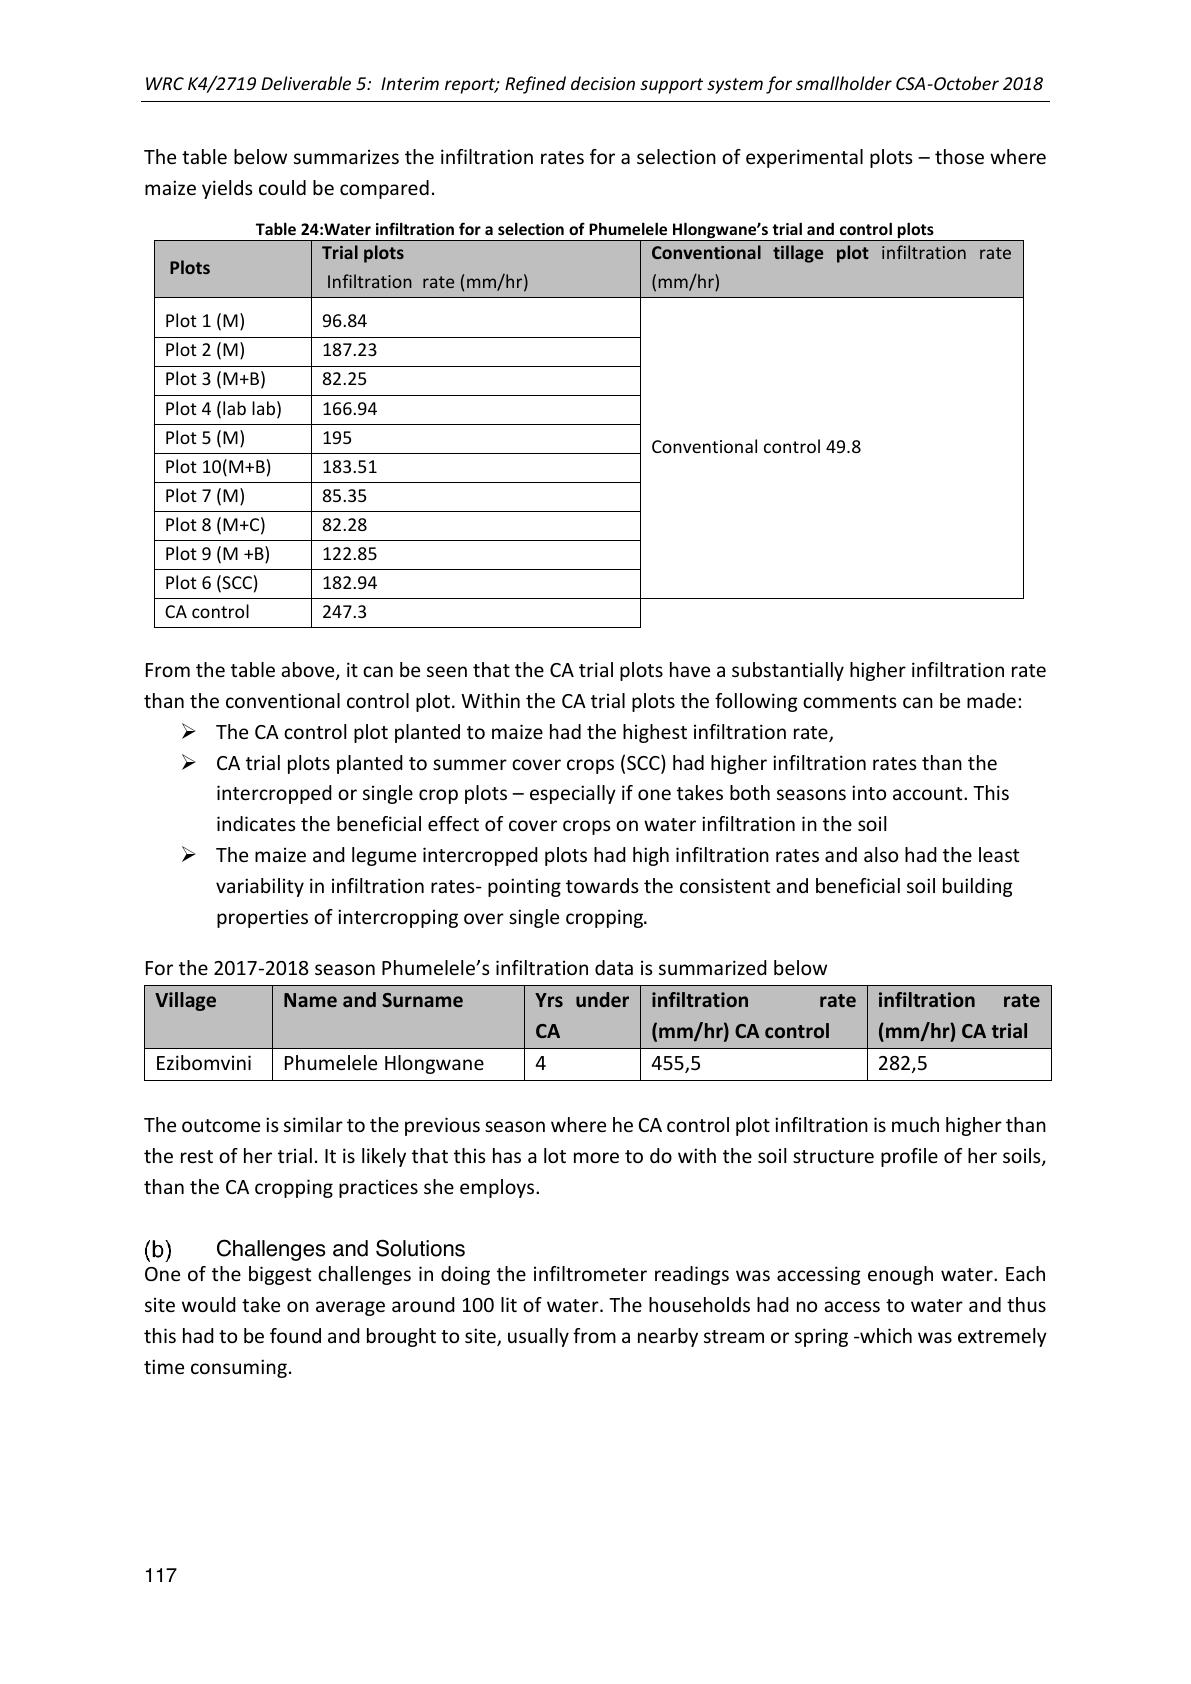
WRC K4/2719 Deliverable 5: Interim report; Refined decision support system for smallholder CSA-October 2018
117
The table below summarizes the infiltration rates for a selection of experimental plots –those where
maize yields could be compared.
Table 24:Water infiltration for a selection of Phumelele Hlongwane’s trial and control plots
Plots
Trial plots
Infiltration rate (mm/hr)
Conventional tillage plotinfiltration rate
(mm/hr)
Plot 1 (M)
96.84
Conventional control 49.8
Plot 2 (M)
187.23
Plot 3 (M+B)
82.25
Plot 4 (lab lab)
166.94
Plot 5 (M)
195
Plot 10(M+B)
183.51
Plot 7 (M)
85.35
Plot 8 (M+C)
82.28
Plot 9 (M +B)
122.85
Plot 6 (SCC)
182.94
CA control
247.3
From the table above, it can be seen that the CA trial plots have a substantially higher infiltration rate
than the conventional control plot. Within the CA trial plots the following comments can be made:
➢The CA control plot planted to maize had the highest infiltration rate,
➢CA trial plots planted to summer cover crops (SCC) had higher infiltration rates than the
intercropped or single crop plots –especially if one takes both seasons into account. This
indicates the beneficial effect of cover crops on water infiltration in the soil
➢The maize and legume intercropped plots had high infiltration rates and also had the least
variability in infiltration rates- pointing towards the consistent and beneficial soil building
properties of intercropping over single cropping.
For the 2017-2018 season Phumelele’s infiltration data is summarized below
Village
Name and Surname
Yrs under
CA
infiltration rate
(mm/hr) CA control
infiltration rate
(mm/hr) CA trial
Ezibomvini
Phumelele Hlongwane
4
455,5
282,5
The outcome is similar to the previous season where he CA control plot infiltration is much higher than
the rest of her trial. It is likely that this has a lot more to do with the soil structure profile of her soils,
than the CA cropping practices she employs.
Challenges and Solutions
One of the biggest challenges in doing the infiltrometer readings was accessing enough water. Each
site would take on average around 100 lit of water. The households had no access to water and thus
this had to be found and brought to site, usually from a nearby stream or spring -which was extremely
time consuming.

WRC K4/2719 Deliverable 5: Interim report; Refined decision support system for smallholder CSA-October 2018
118
The double ring infiltrometer was construted locally in Pietermatizburg and
was not of a high enough quality to withstand the strain of being hammered
into extremely hard soils.
For the coming seaons the following remedial activities are to be undertken:
•Compare only CA plots with conventional control plots and discard the
comparsion of different CA cropping prctices
•Ensure that infiltrometer readsingare taken in a rainy perdio when
soils are reasonably wet
•Include infiltrometer tests for other areas and regions –e.g. Southern
KwaZulu Natal, Midlands, Limpopo (although for the latter continued
lack of rain is likley to be an issue)
It is likely that the project will discontinue these efforts in the future and rely
more heavily on gravimetric water soil sampling and analysis.
Gravimetric soil water content results and discussion
Gravimetric soil water content gives us an indicationof available water in the soil at different stages
of crop growth and also gives us an indication of water use by the crops at these different stages.
It does not indicate whether the water in the soil is enough to support the growth of the particular
crop, but provides for a qualitative assessment of how much water a crop is using for growth at
different stages of growth.
The assessments were done at four stages; namelyestablishment, vegetative growth, productive
growth and harvesting at four different soil depths; 30cm,60cm, 90cm and 120cm.

WRC K4/2719 Deliverable 5: Interim report; Refined decision support system for smallholder CSA-October 2018
119
The 4 small tables below indicate the gravimetric soil water content for different crops within
Phumelele Hlongwane’s CA trail plots for 2017-2018
Figure 14: Gravimetric soil water content at four different depths for a selection of Phumelele Hlongwane’s CA trial plots
(M=maize, SCC-= summer cover crop mix, B=beans, CP=cowpea and Lab-lab= Dolichos beans
From the figure above the following observations can be made:
•The soil water content at all four depths is similar throughout the growing season indicating
a deep well drained soil and also pointing to the presence of enough soil water to support
the growth of the crops planted.
•Lab-Lab beans use the most water during their vegetative growth stage at depths from 30-
90cm in the soil and access soil water down to 120cm in depth for their productive growth.
It indicates their ability to resist drought by accessing water deep in the soil for seed
production towards the end of the season. In addition, the water use from the vegetative
and productive stages of growth (for all four soil depths) is the least of all the crops (which
could indicate less water use, but also saving water through reduced evaporation and
canopy cover.
End of
ebstab
lishme
nt
Vegeta
tive
stage
Produ
ctive
stage
Harve
sting
Lab-Lab 0.27 0.21 0.20 0.19
M+CP 0.17 0.01 0.14 0.20
B0.20 0.15 0.13 0.20
SCC 0.16 0.20 0.11 0.15
Control M0.19 0.21 0.13 0.16
0.00
0.05
0.10
0.15
0.20
0.25
0.30
Soil water content (g/g)
Depth 60 cm
End of
ebstab
lishme
nt
Vegeta
tive
stage
Produ
ctive
stage
Harve
sting
Lab-Lab 0.24 0.19 0.18 0.18
M+CP 0.19 0.01 0.15 0.22
B0.19 0.18 0.13 0.19
SCC 0.17 0.19 0.11 0.17
Control M0.17 0.20 0.14 0.16
0.00
0.05
0.10
0.15
0.20
0.25
0.30
Soil Water Content (g/g)
Depth 90 cm
End of
ebstab
lishme
nt
Vegeta
tive
stage
Produ
ctive
stage
Harve
sting
Lab-Lab 0.19 0.23 0.18 0.20
M+CP 0.20 0.01 0.17 0.18
B0.19 0.17 0.14 0.17
SCC 0.19 0.17 0.10 0.14
Control M0.18 0.22 0.14 0.18
0.00
0.05
0.10
0.15
0.20
0.25
Soil Water Content (g/g)
Depth 120 cm
End of
ebstab
lishme
nt
Vegeta
tive
stage
Produ
ctive
stage
Harve
sting
Lab-Lab 0.25 0.20 0.18 0.18
M+CP 0.19 0.01 0.14 0.17
B0.19 0.13 0.14 0.16
Control M0.17 0.36 0.13 0.16
SCC 0.18 0.11 0.10 0.13
0.00
0.05
0.10
0.15
0.20
0.25
0.30
0.35
0.40
Soil water content (g/g)
Phumelele Hlongwane depth
30 cm

WRC K4/2719 Deliverable 5: Interim report; Refined decision support system for smallholder CSA-October 2018
120
•Maize has a high demand for water in the productive stage at all four depths measured.
•Beans use water evenly through their vegetative and productive stage and access water for
the productive stage primarily from the deeper soil depths of 90-120cm.
•The SCC use the most water of all the crops during the establishment phase at around 30cm
of soil depth. Once these crops reach the vegetative and productive stage, they draw their
water from deeper in the soil; 60-120cm depths.
•The Maize and cowpea combination use a large amount of water from all four soil depths
30-120cm in the vegetative stage of growth. This points towards considerable competition
between the maize and cowpea during this growth stage. This result is corroborated by the
water productivity results indicating lower productivity for maize when intercropped with
cowpeas.
This exercise provides a reasonably good benchmarkfor crops suitable for saving water in the soil
profile over the full period of crop growth, whichcrops use water where in the soil profile and
consequently good intercropping combinations.From the results, Lab-Lab beans show a remarkable
ability to save soil water during the vegetative and productive phases of the maize crop –meaning
that this crop is very suitable for intercropping; much more so than cowpeas from a water use
perspective, as the latter compete with maize during the vegetative growth phase.
Care needs to be taken with planting SCC mixes as these require a lot of water in the 30-60cm soil
depth range for establishment.
Results (Water Productivity in Conservation Agriculture fields)
Data collection in this season provided a few challenges:
•Inexperience with working with weather stations meant the ET0values were not
automatically recorded as could have been the case, but had to be manually calculated using
surrogate data
•Rainfall was not measured very accurately by the households with rain gauges- some
participants were a lot more meticulous than others.
As a result, the data collected in this season was not adequate to run a model to allow us to compare
simulated and observed values of evapotranspiration (ET) and water productivity (WP). The results
presented in this section were observed values and were computed manually following the equations
presented in the methodology section.
Our assumption for this farmer level experiment, or the hypothesis, is that water productivity of an
intercropping system will be better than that of a monocropping system under CA.
Enough data was collected for two of the three sites and participants; Phumelele Hlongwane from
Ezibomvini (PH) and Ntombakhe Zikode from Eqeleni (NZ).
Trial and Control layouts and parameters
Phumelele Hlongwane (Ezibomvini- Bergville)
Experimentation
Phumelele’s trials were continued in this season. The layoutof her plots is shownbelow for the
2015/16, 2016/17 and 2017/18 planting seasons. Sheis practicing crop rotation as well as
intercropping and planting of summer and winter cover crop mixes.

WRC K4/2719 Deliverable 5: Interim report; Refined decision support system for smallholder CSA-October 2018
121
(10)
M + B
(5)
M
Control plot
(8)
M + CP
(6) sunhemp,
millet and
sunflower
(3)
M + B
Control
plot
(9)
M + B
(7)
M
(4)
LL
(2) M +
runoff plot
(1)
M
Trial layout 2016/17 Legend: M –Maize; B –Beans; CP –Cowpea; LL –Lab lab
(10)
M + B
(5)
LL
Control plot
(8)
M + B
(6)
M +LL
(3) M + SCC
+WCC
Control
plot
(9)
M + CP
(7)
M + CP
(4)
M + B
(2) Sunhemp,
millet and
sunflower
(1)
M + B
Trial layout 2015/16 Legend: M –Maize; B –Beans; CP –Cowpea; LL –Lab Lab
(10)
M
(5)
LL
Control plot
(8)
B
(6)
M +CP
(3)
M
Control
plot
(9)
SCC
(7)
M + CP
(4)
M
(2)
M + B
(1)
M
Trial layout 2017/18 Legend: M –Maize; B –Beans; CP –Cowpea; LL –Lab Lab

WRC K4/2719 Deliverable 5: Interim report; Refined decision support system for smallholder CSA-October 2018
122
The table below provides a summary of the rotations employed across her trial plots.
Table 25: Table outlining rotations undertaken in Phumelele’s trial and control plots over the last three seasons,
including and indication of installation of runoff plots.
Right: A view of Phumelele’s
maize and cowpea
intercropped plot and Far
Right: A view of Phumelele’s
Lab-Lab plot in the 2017-2018
season. She rotates these
plots in her intercropping and
rotation system. Behind the
visitors is a plot of inter
cropped maize and
sunflower.
Ntombakhe Zikode (Eqeleni)
Experimentation
In Eqeleni, the 1000 m2 farmer level trials are divided into 5 plots (20 m*10 m). The last crop rotation
plot is split into two to allow for 2x (10 m* 10 m) plots, planted to sole Maize crop and summer cover
crop mix of sunflower, sunnhemp and millet respectively.
Plot no
2015/16
2016/17
2017/18
Run off plots
1
M+B
M
M +WCC
Grey squares indicate run-off plots
2
SCC
M
M+B
Rotations have been done attempting
to ensure a different crop/crop mix on
each plot in each consecutive year.
A further refinement of the schedule
to be a 3-year rotation of; single crop
–intercrop-cover crop, will be
adhered to into the future
3
M+SCC+WCC
M+B
M
4
M+B
LL
M
5
LL
M
LL
6
M+LL
SCC
M+CP
7
M+CP
M
M+CP
8
M+B
M+CP
B
9
M+CP
M+B
SCC
10
M+B
M+B
M
Control: M
Control: M
Control: M
(CA)
Control: M+B
(CA)
M+B+WCC
M+B+WCC
M+C
M+B
M SCC
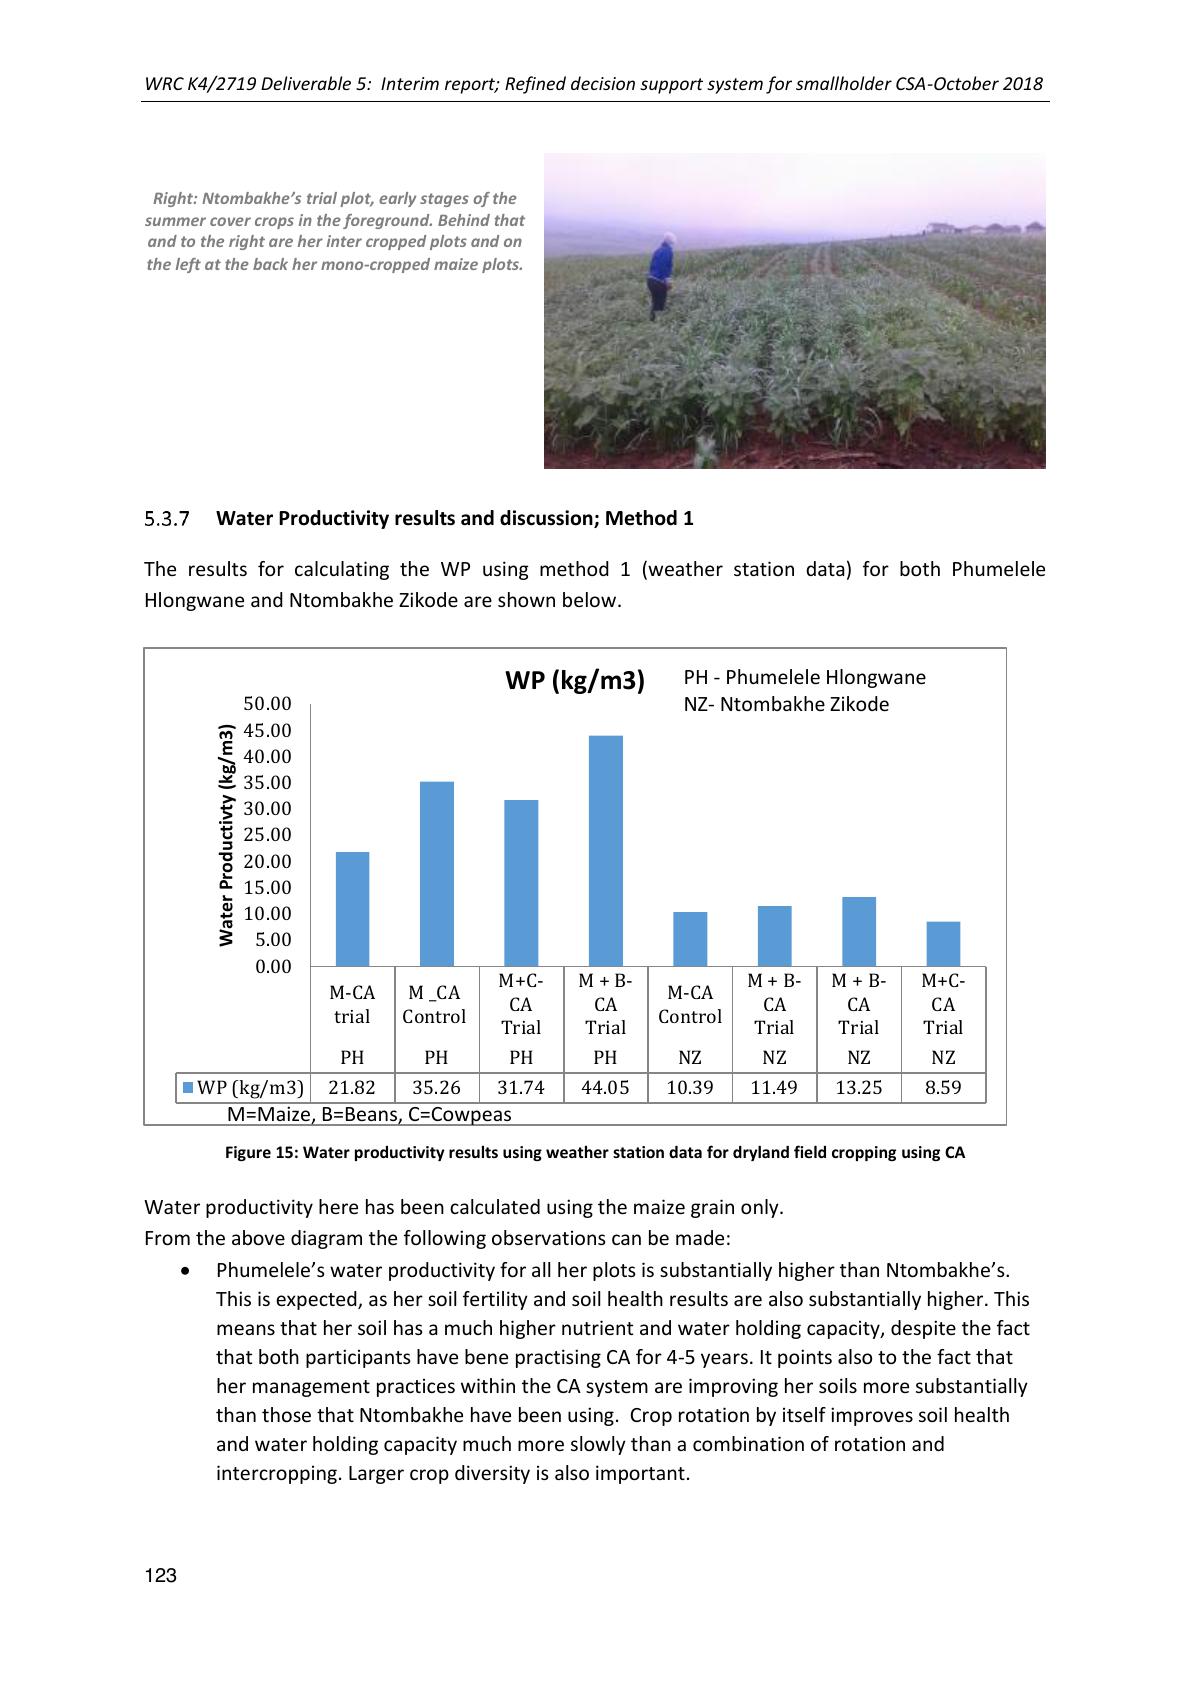
WRC K4/2719 Deliverable 5: Interim report; Refined decision support system for smallholder CSA-October 2018
123
Right: Ntombakhe’s trial plot, early stages of the
summer cover crops in the foreground. Behind that
and to the right are her inter cropped plots and on
the left at the back her mono-cropped maize plots.
Water Productivity results and discussion; Method 1
The resultsfor calculating the WP using method 1 (weather station data) for both Phumelele
Hlongwane and Ntombakhe Zikode are shown below.
Figure 15: Water productivity results using weather station data for dryland field cropping using CA
Water productivity here has been calculated using the maize grain only.
From the above diagram the following observations can be made:
•Phumelele’s water productivity for all her plots is substantially higher than Ntombakhe’s.
This is expected, as her soil fertility and soil health results are also substantially higher. This
means that her soil has a much higher nutrient and water holding capacity, despite the fact
that both participants have bene practising CA for 4-5 years. It points also to the fact that
her management practices within the CA system are improving her soils more substantially
than those that Ntombakhe have been using. Crop rotation by itself improves soil health
and water holding capacity much more slowly than a combination of rotation and
intercropping. Larger crop diversity is also important.
M-CA
trial
M _CA
Control
M+C-
CA
Trial
M + B-
CA
Trial
M-CA
Control
M + B-
CA
Trial
M + B-
CA
Trial
M+C-
CA
Trial
PH PH PH PH NZ NZ NZ NZ
WP (kg/m3)21.82 35.26 31.74 44.05 10.39 11.49 13.258.59
0.00
5.00
10.00
15.00
20.00
25.00
30.00
35.00
40.00
45.00
50.00
Water Productivty (kg/m3)
WP (kg/m3)
PH - Phumelele Hlongwane
NZ- Ntombakhe Zikode
M=Maize, B=Beans,C=Cowpeas

WRC K4/2719 Deliverable 5: Interim report; Refined decision support system for smallholder CSA-October 2018
124
•For both participants the water productivity for their maize and bean intercropped plots is
higher than for the maize only and the maize and cowpea plots. This trend has been noted
also in the soil health test results and is interesting as it does not hold with the assumptions
made by the implantation team that the maize and cowpea intercropped plots would out-
perform the maize and bean intercrops.
•For both participants the water productivity of the mono-cropped maize plots is higher than
that of their maize and cowpea intercropped plots. This points to a certain level of
competition from the cowpeas intercropped with the maize
•For Phumelele, water productivity for her CA control mono-cropped maize is quite a bit
higher than her CA trial mono-cropped maize. Her management practices for the two plots
are very similar (using the same procedures, fertilizers and maize varieties), pointing to
different water productivity potentials in her plots. This variability has been noted also in
measurements of soil characteristics, water holding capacity and yields.
The yields across the plots within a trial can vary considerably. The expectation is that after a number
of years, the mixture of intercropping and crop rotation would mean that the soil builds up across the
plots and that the yields would even out as they increase. This is as yet not happening.
A more in-depth look at the actual rotations and yields for Phumelele Hlongwane, are presented in
the table below.
Table 26: Maize yields per plot in Phumelele Hlongwane’s rotation system:2015-2017
Phumelele Hlongwane: Comparison of maize yields per plot:2015-2017
Plots
2015/2016 season
2016/2017 Season
2017/2018 Season
Crops Planted
Yields
(t/ha)
Crops planted
Yields
(t/ha)
Crops planted
Yields
(t/ha)
Change
in yield
(t/ha)
Plot 10
Maize +Beans
8,3
Maize + Beans
8,8
Maize
11,5
2,8
Plot 9
Maize +Cowpea
8,7
Maize + Beans
8,9
SCC
Plot 8
Maize + Beans
10,4
Maize + Cowpea
7,7
Beans
Plot 7
Maize +Cowpea
6,9
Maize
6,5
Maize + Beans
16,3
9,8
Plot 6
Maize +Lab-lab
3,4
SCC
Maize +
Cowpea
12,4
Plot 5
Lab-Lab
NA
Maize
8,8
Lab-Lab
NA
Plot 4
Maize+ Beans
8,7
Lab-lab
Maize
10,3
Plot 3
M +SCC+WCC
8,7
Maize + Beans
10,1
Maize
11,0
0,9
Plot 2
SCC
Maize
10,0
Maize + Beans
14,2
4,2
Plot 1
Maize +Beans
6,9
Maize
6,2
Maize
8,9
2,7
This season (2017-2018) has seen a remarkable increase in yield across all the plots where maize has
been grown, with yields that seem to be almost unheard of. These calculations and yields have been
checked and re-checked given this near impossible outcome and appear to be correct as far as the
team can tell. The variety of maize planted was PAN6479.
Rainfall as recorded by the farmers has averaged around 563mm this season as compared to an
average of around 527mm for last season. These amounts are considered similar enough to not have
a major influence on yield differences noticed.

WRC K4/2719 Deliverable 5: Interim report; Refined decision support system for smallholder CSA-October 2018
125
The difference in maize yield from one plot to another does not appear to be directly related to the
previous rotations, although in general those that include legumes and summer cover crops in a three-
year rotation prior to planting a monocrop of maize, are higher than the plots where maize has
followed on maize.
Biomass water productivity results
These have been calculated for maize plants only. The graph below provides the dry mass of the whole
above ground plant, forthose plantsselected also to measure the grain yiled for the WP results shown
above
Figure 16: Biomass water productivity results using weather station data for dryland field cropping using CA
From the graph above the following comments can be made:
•Phumelele’s biomass results for all her plots is substantially higher than Ntombakhe’s.
•Biomass results for the mono-cropped trial maize plots are higher than the maize and bean
and maize and cowpea intercropped plots for both participants. This shows that even
though the grain production for maize is increased in the maize and bean intercropped plots,
the biomass yield of maize is reduced in the intercropping situation. This does however not
include the added grain and biomass yields of the legumes themselves.
•Biomass results for the maize and bean intercropped plots are higher than the maize and
cowpea intercropped plots for both participants. For the maize and cowpea intercropped
plots both the grain and biomass yields for maize are reduced and do not hold with the
assumption that intercropping with cowpeas can improve growth of the maize plants.
•For Phumelele, the biomass results for her maize mono-crop trial plots are substantially
higher than her maize monocrop CA control plot. Here the value of the rotation and
intercropping becomes more visible, given that the CA control plot is planted to maize every
year but the maize CA trial plot is rotated within her trial. The latter provides for a
substantial increase in biomass production and also water productivity.
M-CA
trial
M _CA
Control
M+C- CA
Trial
M + B-CA
Trial
M-CA
Control
M + B-CA
Trial
M + B-CA
Trial
M+C- CA
Trial
PH PH PH PH NZ NZ NZ NZ
Series1 87 43 64 83 34 21 19 17
0
10
20
30
40
50
60
70
80
90
100
Biomass kg/m3
Biomass data(kg/m3)
PH - Phumelele Hlongwane
NZ- Ntombakhe Zikode

WRC K4/2719 Deliverable 5: Interim report; Refined decision support system for smallholder CSA-October 2018
126
In summary the WP results indicate the following:
•Water productivity for mono cropped maize is substantially improved in a crop rotation
system under CA (3- year rotation that includes legumes and a mix of cover crops)
•Water productivity for maize and bean intercrops (grain and biomass yield) is higher than
maize produced in a mono-crop under CA
•Water productivity for maize and cowpea intercrops (grain and biomass) is lower than both
maize produced in a mono-crop and maize and bean intercrops.
Water productivity for gardening systems
Both Phumelele Hlongwane of Ezibomvini village and Ntombakhe Zikode of Eqeleni village in Bergville
established experiments to investigate water productivity in their household vegetable gardening
systems. Their experiment consisted of:
•Trench bed under tunnel, with mulching (shading) and
•trench bed without shading with mulching and
•Normal bed (this is the control bed, planted in the “normal” way that these participants
have been preparing vegetable production beds- mostly dug over, with some manure added
in the planting holes.)
They both planted spinach for this experiment which ran from 2nd of July November 2018.In both
cases chameleon water sensors were installed in all three beds for participants to exploretheir
irrigation scheduling and participants also recorded amount of irrigation and harvests.
In the end,only the crops in the two trench beds (inside andoutside the tunnel) were compared, as
both participants abandoned their normally plantedbeds mid-season due to lack of growth and
difficulties with access to water for irrigation.
The table below outlines WP determined using both the weather station data and the simpler version
of water applied that farmers prefer.
Table 27: Water productivity for gardening practices for two participants from Bergville; July-Aug 2018
*Note; irrigation records for NZ were not very reliable and from inspection show more water applied in her tunnel than is likely the case.
Thus the difference in WP for farmers’ method for NZ do not follow the trend.
From the table, the WP results (scientific) indicate that the WP for the trench beds inside the tunnel
is around double that of the WP outside the tunnel for the trench beds. For three of the four results
(excluding NZ’s tunnel inside her tunnel due to unreliable records for water applied) the WP calculated
using the scientific and simpler methods correlate well; indicating little effect from evaporation or
deep percolation –which is to be expected for the winter season in KZN.
Bgvl June-Sept 2018
Simple scientific method (ET)
Farmers' method (Water applied)
Name of famer
water use
(m3)
Total weight
(kg)
WP
(kg/m3)
water use
(m3)
Total weight
(kg)
WP
(kg/m3)
Phumelele Hlongwane(PH);
trench bed inside tunnel
1,65
21,06
12,76
1,85
21,06
11,38
Phumelele Hlongwane; trench
bed outside tunnel
0,83
5,32
6,45
1,75
5,32
3,04
Ntombakhe Zikode(NZ); trench
bed inside tunnel
1,65
17,71
10,73
2,37
17,71
7,47
Ntombakhe Zikode; trench bed
outside tunnel
0,50
3,35
6,76
0,53
3,35
6,33

WRC K4/2719 Deliverable 5: Interim report; Refined decision support system for smallholder CSA-October 2018
127
The effect of micro climate control (shadecloth tunnel) on crop production is much more pronounced
than would have been expected for KZN.
If the results of this experiment is compared to the same process that was conducted with participants
in Limpopo (See the table below for reference –from Deliverable 5), the WPin Limpopo, at least for
one of the two participants is substantially higher.
Table 28: Water productivity for gardening practices for two participants from Limpopo (Sedawa); April -July 2018
Simple scientific method (ET)
Farmers' method (Water applied)
Name of famer
water
use
(m3)
Total
weight (kg)
WP
(kg/m3)
water
use (m3)
Total weight
(kg)
WP (kg/m3)
Christina Thobejane (Tunnel;
trench beds, with mulch)
0,8
48,9
65
1,10
48,9
56,7
Christina Thobejane(Furrows and
ridges with mulch)
0,5
24,5
46,4
3,91
24,5
5
Christina trench outside
0,8
14,7
18,4
2,93
14,7
11,3
Nora Mahlako (Tunnel; trench
beds without mulch)
0,8
19,6
26
9,47
19,6
5
One of the reasons for this trend could be that the participants inBergville were in fact over-irrigating
their bedsinitially, an assumption corroborated by the Chameleon water sensor data presented
below. The Bergville participants kept more to the suggested practice of using the drip kits and then
added water by hand if they thought that their beds looked dry. They did not water according the
chameleon sensor readings. It would appear that the suggested practice of one bucket (20l) per day
for the dripping system in fact led to overwatering. This could also be due to the fact that these crops
were grown during the winter and that water demand in this period is lower.
A rough cost-benefit analysis for the trench beds in and outside tunnels for the Bergville area is shown
in the table below
Water
applied
Cost
(R/m2)
Yield/
m2
Sales (Rands
/ m2)
Profit (R/m2)
Trench inside tunnel
1650
R0,00
2,6
R26
R26,00
Trench inside tunnel
1650
R13,12
2,6
R26
R12,80
Trench outside tunnel
830
R0,00
1,6
R16
R16,00
Trench outside tunnel
830
R6,64
1,6
R16
R9,36
This indicates the income potential for these small tunnels to be around R400 for a 3month period,
growing spinach and assumingwater does not need to be paid for. Note that in some cases
participants are paying R300/2500l to have their Jo-Jo tanks filled up. In this case the profitability
reduces dramatically to around R12,8/m2(assume 15m2of planting inside and outside the tunnel)
The participants also visually compared the growth of the spinach crop throughout the season
The photos below are indicative.

WRC K4/2719 Deliverable 5: Interim report; Refined decision support system for smallholder CSA-October 2018
128
Right: Spinach growing in
Phumelele’s Tunnel Far Right:
Spinach growing outside the
tunnel
Right: Spinach harvested from
trench bed insidetunnel and Far
Right: spinah harvested from
outside the tunnels
From observations, the quality of the spinach in the tunnel is better than that of the spinach ouside
the tunnel, spinach leaves outside the tunnel are darker and shorter compared to those inside the
tunnel.

WRC K4/2719 Deliverable 5: Interim report; Refined decision support system for smallholder CSA-October 2018
129
Right: Spinach growing in
Ntombakhe’sTunnel Far Right: Spinach
growing outside the tunnel
Right: Weighing of spinach and
Ntombakhe with a bundle of spainch from
her tunnel
Chameleon Results for the cropping period inside and outside the tunnels
Below are the readings of the chameleon water sensros for Phumelele Hlongwane in the trench beds
inside and outside her tunnel, as well as a normal garden bed, summarised for the last 6 months.
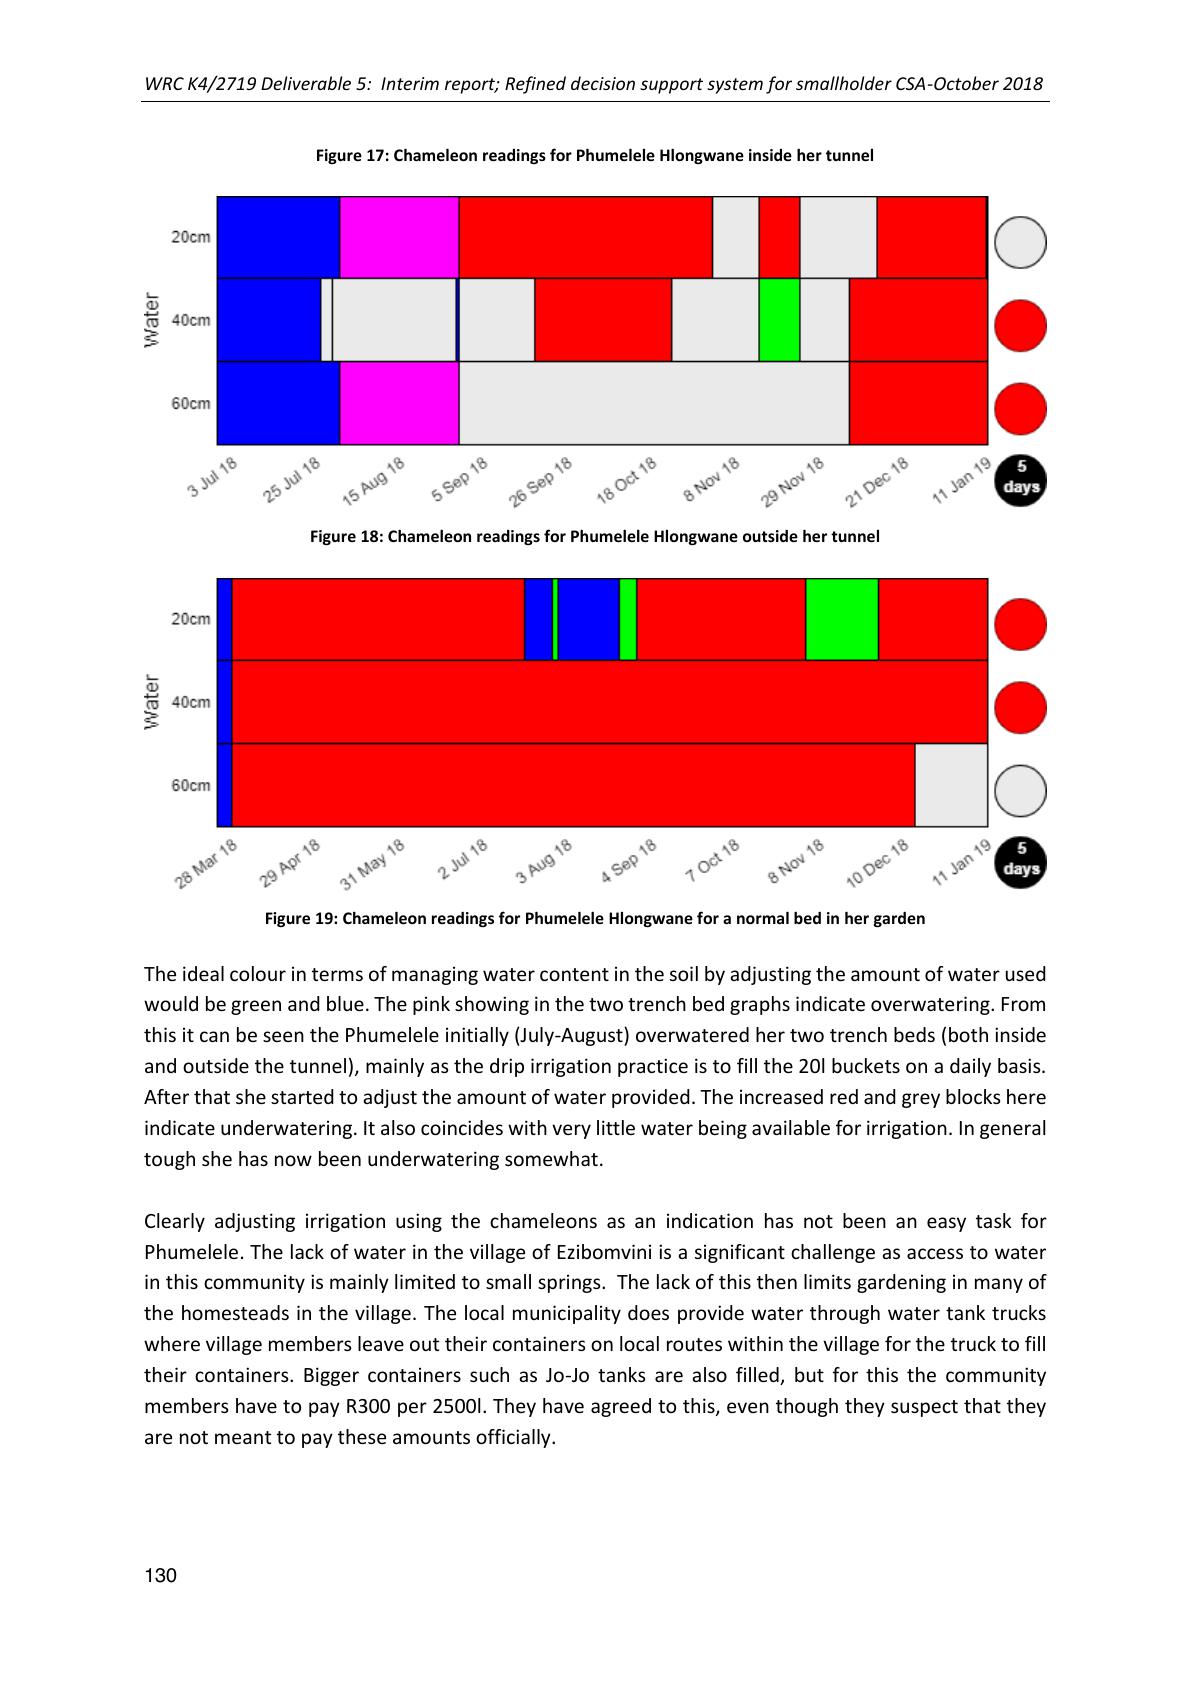
WRC K4/2719 Deliverable 5: Interim report; Refined decision support system for smallholder CSA-October 2018
130
Figure 17: Chameleon readings for Phumelele Hlongwane inside her tunnel
Figure 18: Chameleon readings for Phumelele Hlongwane outside her tunnel
Figure 19: Chameleon readings for Phumelele Hlongwane for a normal bed in her garden
The ideal colour intermsof managing water contentin the soil by adjusting the amountof water used
would be green and blue.The pink showing in thetwo trench bed graphs indicate overwatering. From
this it can be seen the Phumelele initially (July-August) overwatered her two trench beds (both inside
and outside the tunnel), mainly as the drip irrigation practice is to fill the 20l buckets on a daily basis.
After that she started to adjust theamount of water provided. The increased red and grey blocks here
indicate underwatering. It also coincides with very little water being available for irrigation. In general
tough she has now been underwatering somewhat.
Clearly adjusting irrigationusing the chameleons as anindication has not been an easy task for
Phumelele. The lack of water in the village of Ezibomvini is a significant challenge as access to water
in this community is mainly limited to small springs. The lack of this then limits gardening in many of
the homesteads in the village. The local municipality does provide water through water tank trucks
where village members leave out their containers on local routes within the village for the truck to fill
their containers.Bigger containers such as Jo-Jo tanks are also filled, but for this the community
members have to pay R300 per 2500l. They have agreed to this, even though they suspect that they
are not meant to pay these amounts officially.

WRC K4/2719 Deliverable 5: Interim report; Refined decision support system for smallholder CSA-October 2018
131
In November 2018 a small workshop was held for sharing this experiment with local facilitators and
interested participants from other viallges aroundBergville. Mrs Hlongwane took these ladies thorugh
her epxeimrentation process and showed them the production sinde and outside her tunnel as well
as the chameleons nad weather station
Above Left and right: Learning group participants form neighbouringvillages are taken through the
tunnel and trench bed experiments by Phumelele.
Above left and Right: And are shown the instrumentation used to assess conditions and irrigation
requirements. Note that the spinach at this point outside the tunnel was quite wilted.
The chameleon data obtained for two more participants; Ntombakhe Zikodeand Zodwa Zikode,
showed a similar trend of initially providing sufficient water and struggles to keep up with enough
watering after August. More attention needs to be given for these sensors to be able to work as an
irrigation management tool. Participants water and check the chameleons quitesoon thereafter. Once
the top layer shows a green light theyfeel that enough water has been added. This has lead to the
lower soil layers drying out and staying dry later in the winter season and into the early summer
period. This is not likely to have affected the crop growth of the spinach that much, as it is shallow
rooted, but has led to regular stress and wilting, which has affected the growth and quality.

WRC K4/2719 Deliverable 2: Report on stakeholder engagement, case study development and site identification
Mahlathini Development Foundation August 2017132
6CAPACITY BUILDING AND PUBLICATIONS
Capacity building has been undertaken on three levels:
•Community level learning
•Organisational capacity building
•Post graduate students
Community level and organisational capacity building have continued within this reporting period..
Post graduate students
A number of changes haveoccurred within the postgraduate students. Two students have withdrawn
from this process:
oSylvester Selala has withdrawn from registration of hi PhDconcept and has left the
employ of MDF. He will not pursue a doctorate at this time.
oKhethwie Mthethwa has found permanent employment and is not presently
registered for her second year of an MSC. This is mostly due to the fact the UKZN only
offers 1 year offee remission for Masters candidates and the director of MDF was not
made aware of this fact in time.
Another student has re-registered and is presently self-funded:
oPalesa Motaung has suffered in her registration process due to the ARC not paying
bursaries as awarded to postgraduate students. She has now paid some of her own
fees and commenced with her field work.
And a new PhD candidate has come on board as an intern at MDF
oSamukhelisiweMkhize has recently registered for a PhD in Social Sciences (Policy and
Development Studies). The topic of her concept proposal is An investigation into the
factors limiting and promoting the adoption of CA in smallholder systems in South
Africa (See her concept proposal in Attachment 3)
Progress: Research methodology and initial field work:
oMazwi Dlamini: MPhil - UWC_PLAAS.Factors influencing the adoption and non-
adoption of Conservation Agriculture in smallholder farming systems, and the
implications of these for livelihoods and food security in Bergville, Kwazulu-Natal\
In the last five months Mazwi has commenced with his field work and has undertaken a number of
focus group discussions and started on the individual interviews- which is the first round of the
research process.
Publications and networking
•Publications:
oInstitute of Natural resources: Agroforestry implementation at community level.
•Presentation at conference, networks and forums:
o2nd African Conservation Agriculture Conference (2 ACCA 9-12 October 2018);

WRC K4/2719 Deliverable 2: Report on stakeholder engagement, case study development and site identification
Mahlathini Development Foundation August 2017133
▪Erna Kruger (2 papers); Doing Conservation Agriculture the Innovations
Systems way and Soil health aspects of CA in smallholder farming systems in
South Africa
oNational Climate Change Committee Stakeholder Forum (11 November 2018)
See Attachment 4
▪Erna Kruger: Community Based Climate Smart Agriculture
oAgroecology network workshop (22 November 2018)
▪Erna Kruger: Agroecology best practices in CCA
▪Betty Maimela :Taking stock- Linking Mahlathini farmers to markets
•Awards:
oLandCare: Best Civil Society Organisation in LandCare, 2018
o2 ACCA Conservation Agriculture Champion award.