
Presentation to the National Climate Change Committee Stakeholder
Meeting
11 November 2018
ErnaKruger (Director); info@mahlathini.org
Cell:0820832289
www.mahlathini.org
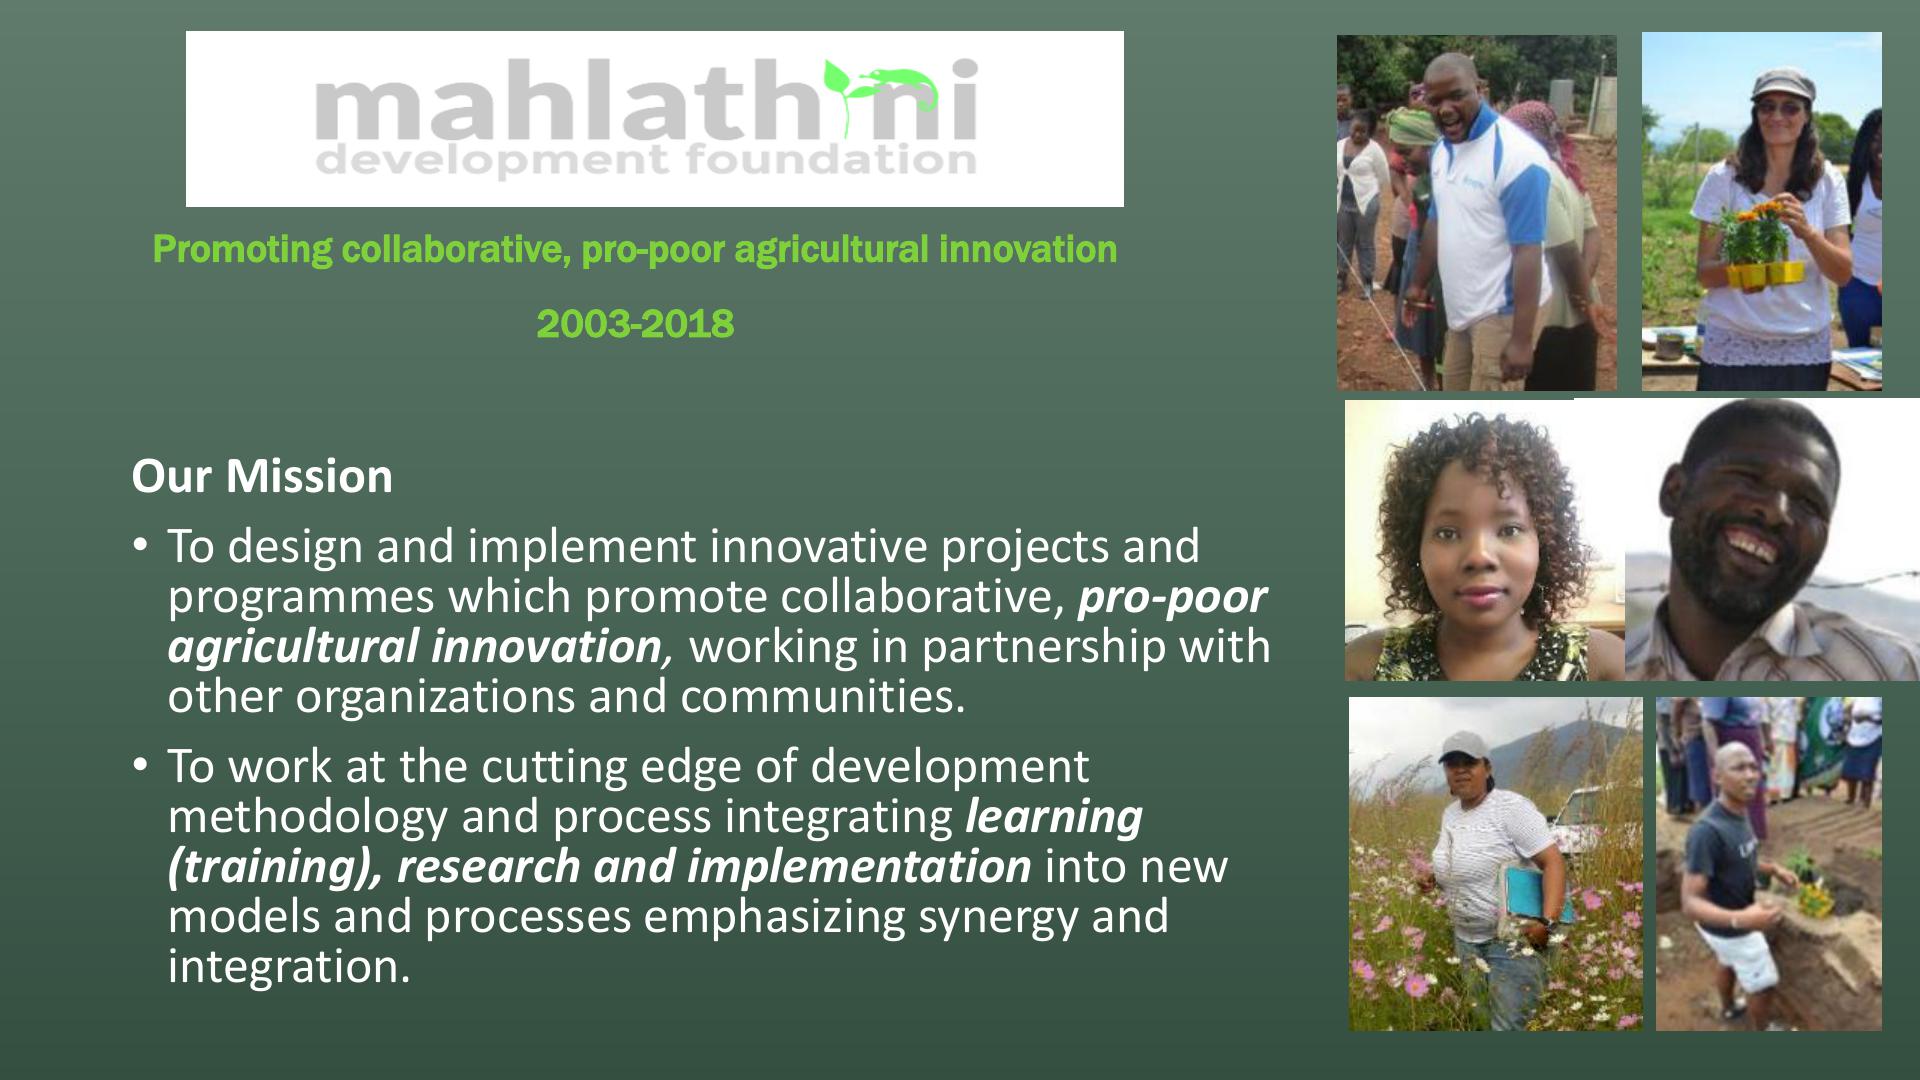
Our Mission
•To design and implement innovative projects and
programmes which promote collaborative, pro-poor
agricultural innovation,working in partnership with
other organizations and communities.
•To work at the cutting edge of development
methodology and process integrating learning
(training), research and implementation into new
models and processesemphasizing synergy and
integration.
Promoting collaborative, pro-poor agricultural innovation
2003-2018

CSA PRINCIPLES
•Minimize external inputs
•Maximise internal diversity
•Focus on soil health and natural soil building techniques
•Take care of the environment
•Use available water as efficiently as possible.
•Work together, learn together and plan together
•Local solutions and economies
•Farmer driven development
•Getting our hands dirty

Community based CCA
•Conservation Agriculture 2013-2018-Maize Trust;
•KZN, EC -550 farmer led CA trials
•Smallholder CSA Decision support 2017-2020 –WRC;
•15 Village based sites across KZN, Limpopo, EC (200
participants)
•(S&WC, agroecology- gardening, CA-field cropping,
livestock and natural resource management)
•Community CCA 2017-2019 –USAID(AWARD);
•7 Villages in Lower Olifants’ Basin (150 participants)

Smallholder farmer innovation programme
Optimising the Conservation Agriculture system for non-commercial
and semi-commercial smallholders 2013-2019

Regenerative Agriculture
•Optimising CA systems for smallholders including
intercropping (maize-legumes), crop rotation, summer and
winter cover crops, minimal input and organic options
•Integration of whole value chain –bulk buying and VSLAs,
local facilitators, farmer centres, storage and processing
options, marketing
•Farmer level experimentation –550 farmers across 33
villages, 8 areas in KZN (Midlands and Southern KZN) and
EC. 50 farmers in 4 villages -Limpopo

CA-Farmer InnovationProgramme
Key objectives and activities
Farmer-centred
Innovation
System
Awareness raising and
Access to Information
Incentives and
Market Based
Mechanisms
On-farm,
farmer-led
Research
Education
and Training
Farmers days,
symposiums, cross
visits, conferences,
popular articles
Subsidies, Village
Saving and Loan
Associations, farmer
centres, group based
access to equipment
and infrastructure
Farmer experimentation;
intercropping, crop
rotation, cover crops,
livestock integration.
Learning groups;
practical
demonstrations,
workshops, field
assessments
Stakeholder interaction,
partnerships, horizontal
and vertical scaling

•All these participants are:
➢Implementing all three
principles of CA,
➢Involved in intercropping
➢Improving yields
➢Including CA into their overall
farming practices.
➢Saving money and increasing
food security considerably
➢Involved in local VSLAs
(Village savings and loan
associations)
➢Using traditional seed
varieties alongside the more
modern OPVs, hybrids and
GM varieties promoted.
Trends for 4th and 5th year participants
Sustainability
has been
achieved
73%have
increased
theirfield
sizes
2-3,5t/ha
Carbon
sequestered in
CA plots
(2016-2017)

•Decreased run-off- increased water
infiltration
•Increased water holding capacity
•Increased organic matter (Organic C and
Organic N)
•Increased crop diversity
•Increased soil fertility
•Decreased need for external inputs
•Increased production
•Increased incomes
•Increase social agency
•Increased savings
Environmental and Livelihoods indicators

•4-5 years: Reduced need for herbicide -no spraying on trial
plots this season
•Increased organic matter, reduced fertilizer requirements -
No basal fertilizer applied- only top dressing
•Reduced runoff
•Increased yields and diversity
Bergville: Case studyMphumelele Hlongwane- Ezibomvini

RESILM
-O: Resilience in the Limpopo Basin Program–Olifants’
Lower Olifants’ catchment
Agricultural Support Initiative (AgriSI);2017-2019
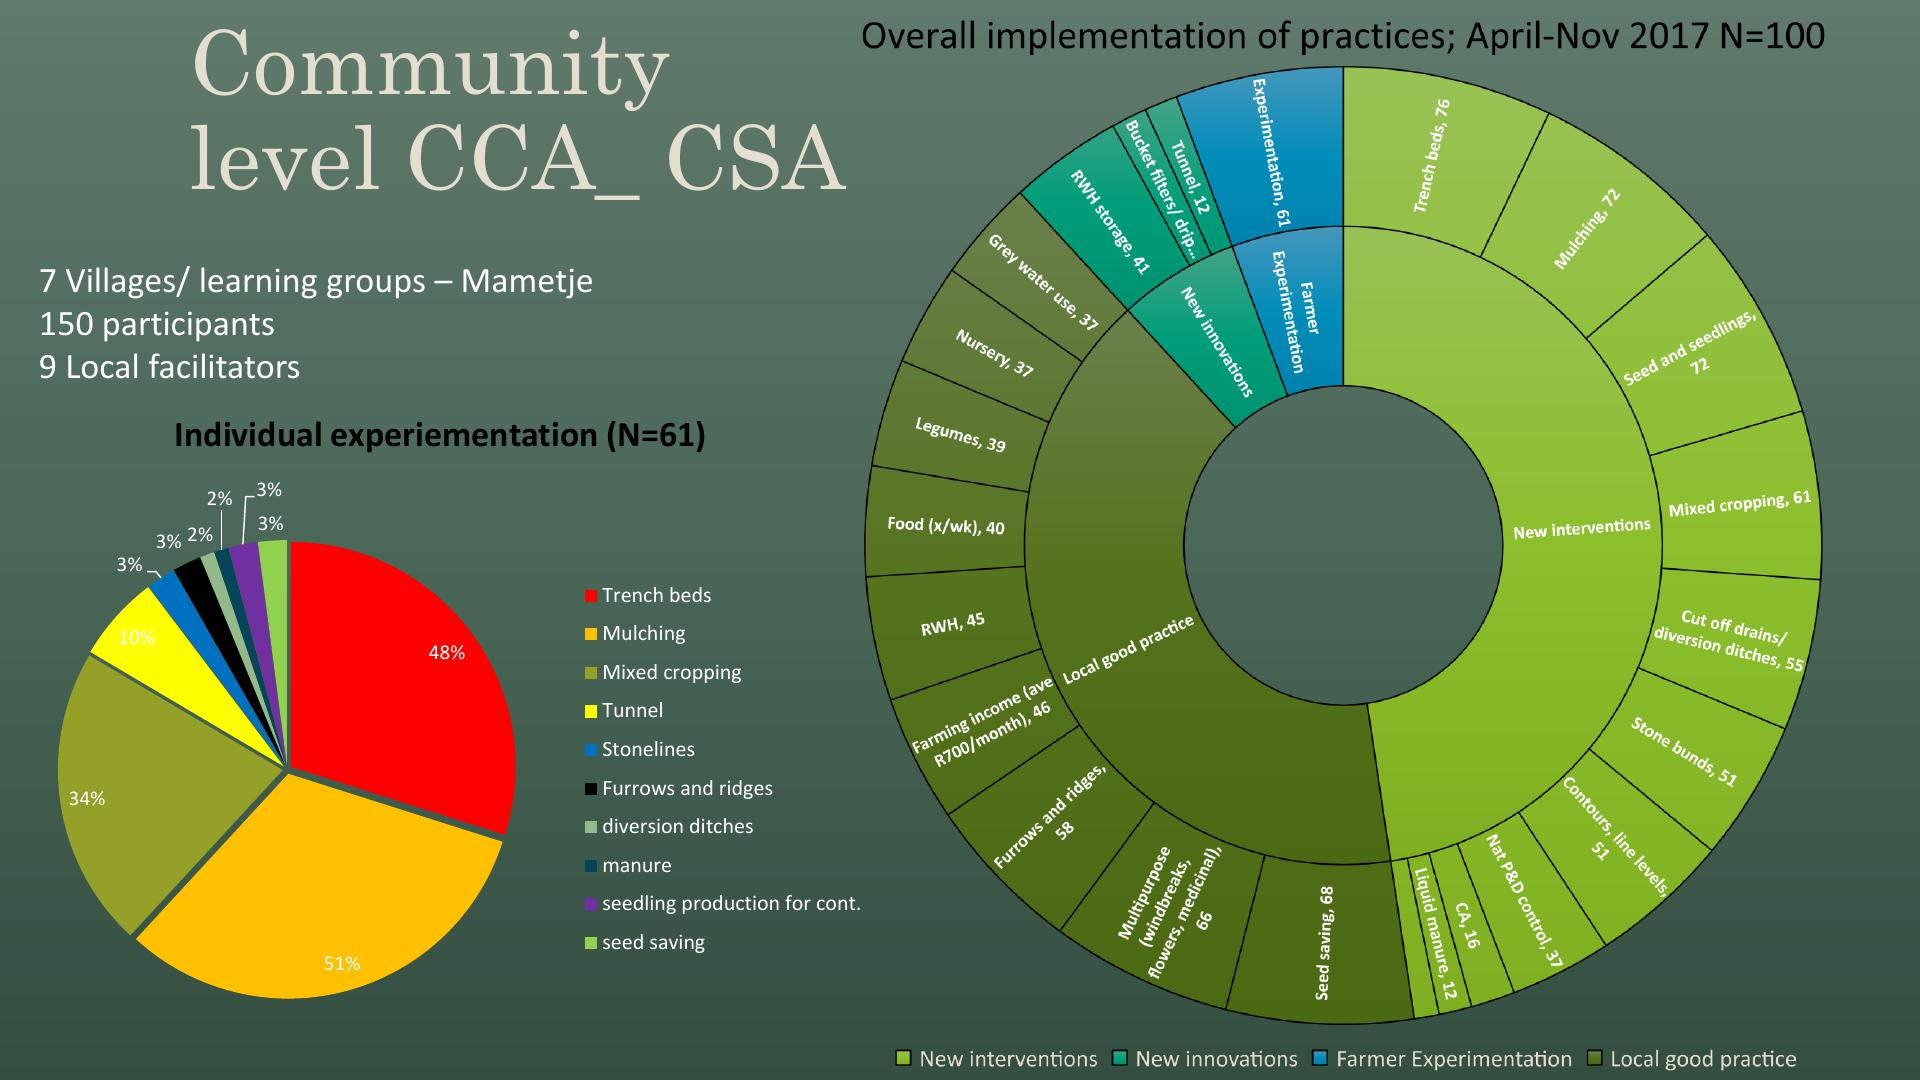
Community
level CCA_ CSA
7 Villages/ learning groups –Mametje
150 participants
9 Local facilitators
48%
51%
34%
10%
3% 3% 2%
2% 3%
3%
Individual experiementation (N=61)
Trench beds
Mulching
Mixed cropping
Tunnel
Stonelines
Furrows and ridges
diversion ditches
manure
seedling production for cont.
seed saving


Production in tunnels
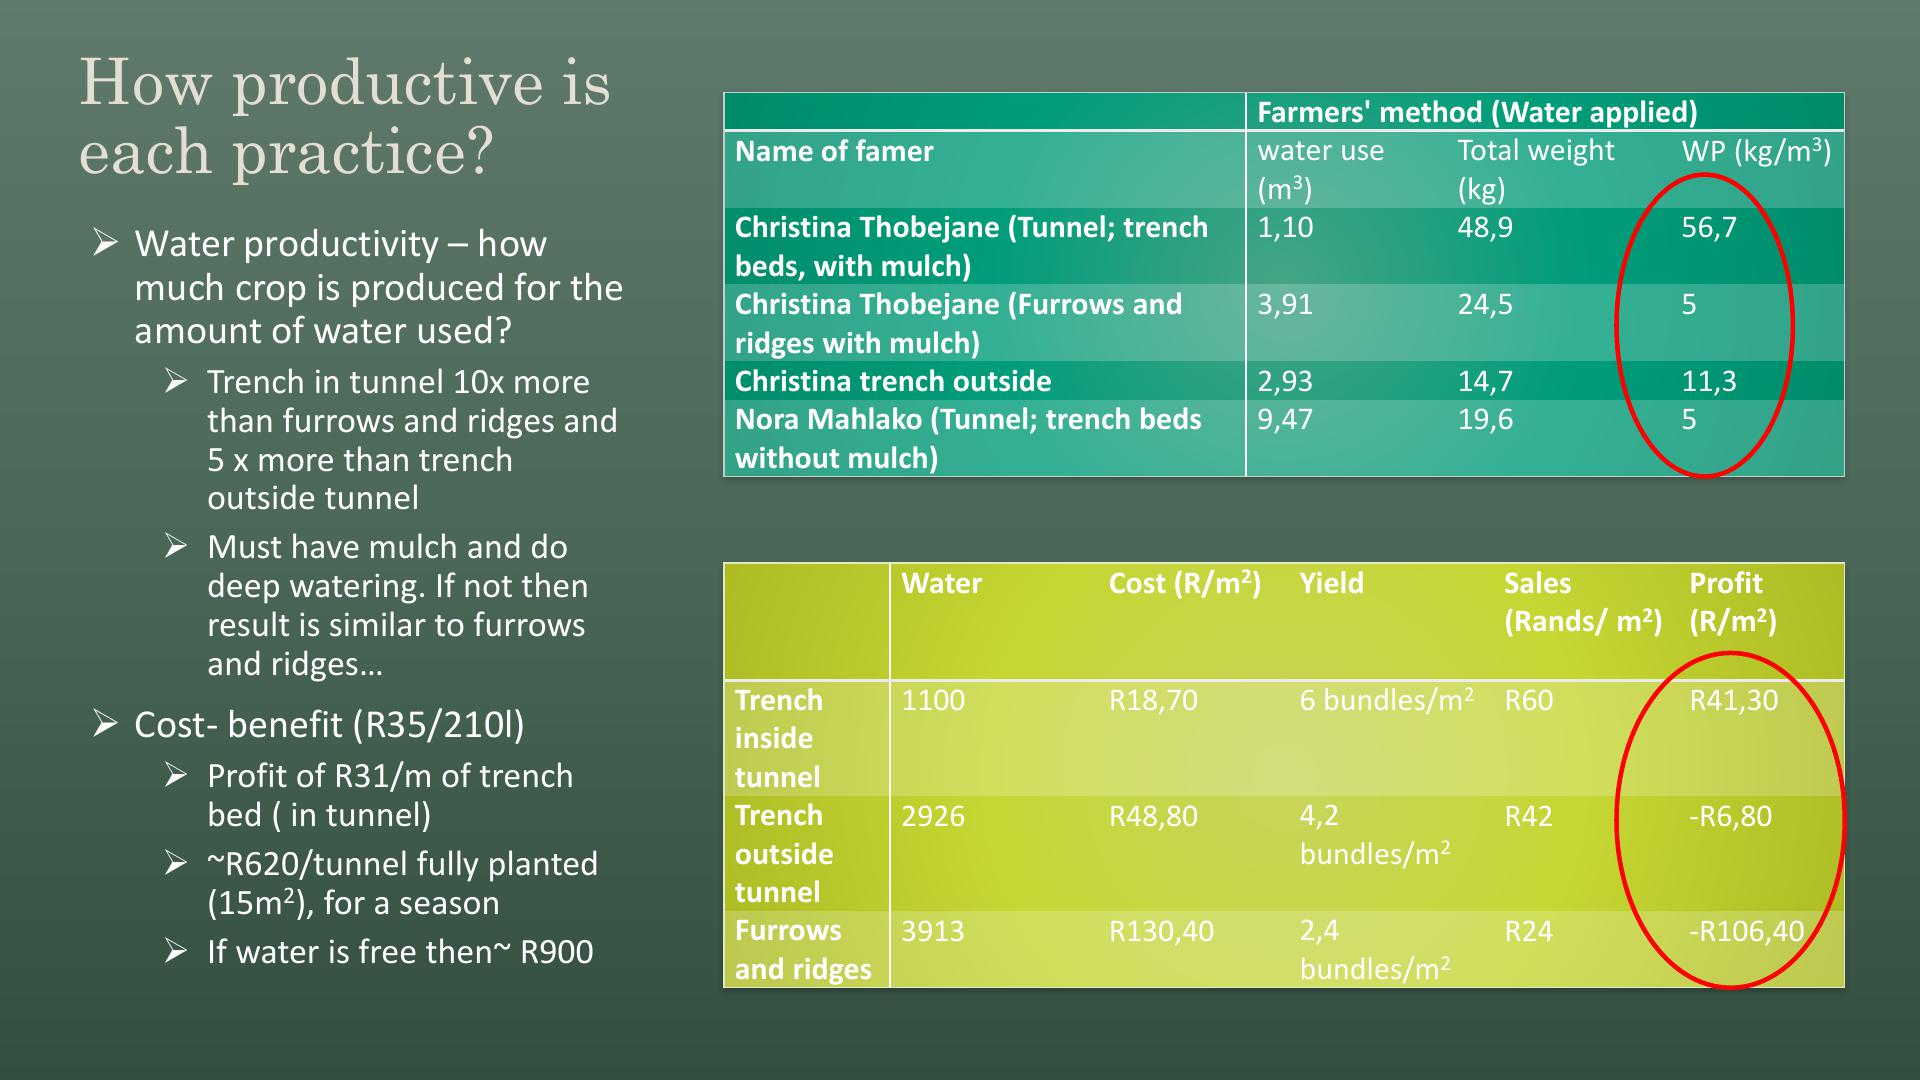
How productive is
each practice?
Water
Cost (R/m
2)
Yield
Sales
(Rands/ m
2
)
Profit
(R/m
2)
Trench
inside
tunnel
1100
R18,70
6 bundles/m
2
R60
R41,30
Trench
outside
tunnel
2926
R48,80
4,2
bundles/m
2
R42
-
R6,80
Furrows
and ridges
3913
R130,40
2,4
bundles/m
2
R24
-
R106,40
➢Water productivity –how
much crop is produced for the
amount of water used?
➢Trench in tunnel 10x more
than furrows and ridges and
5 x more than trench
outside tunnel
➢Must have mulch and do
deep watering. If not then
result is similar to furrows
and ridges…
➢Cost- benefit (R35/210l)
➢Profit of R31/m of trench
bed ( in tunnel)
➢~R620/tunnel fully planted
(15m2), for a season
➢If water is free then~ R900
Farmers' method (Water applied)
Name of famer
water use
(m
3)
Total weight
(kg)
WP (kg/m
3
)
Christina Thobejane (Tunnel; trench
beds, with mulch)
1,10
48,9
56,7
Christina Thobejane (Furrows and
ridges with mulch)
3,91
24,5
5
Christina trench outside
2,93
14,7
11,3
Nora Mahlako (Tunnel; trench beds
without mulch)
9,47
19,6
5
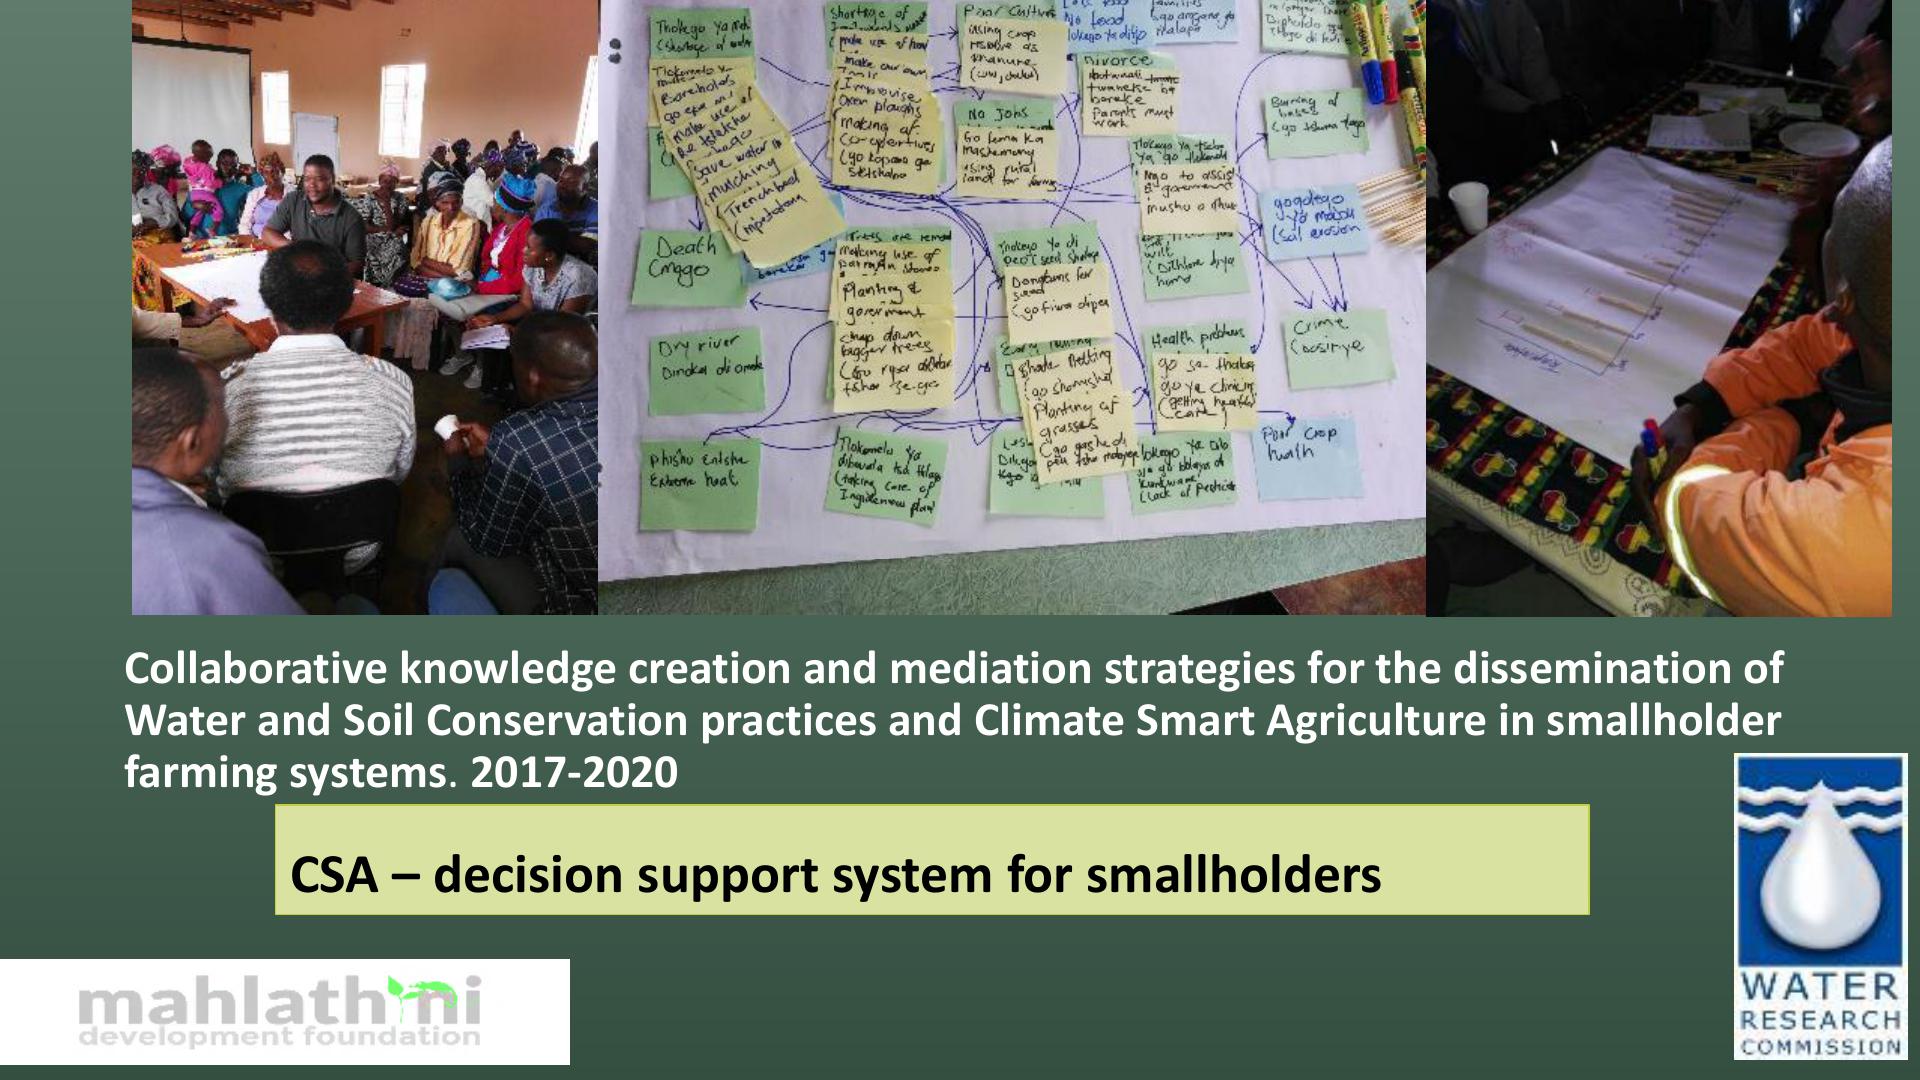
CSA –decision support system for smallholders
Collaborative knowledge creation and mediation strategies for the dissemination of
Water and Soil Conservation practices and Climate Smart Agriculture in smallholder
farming systems.2017-2020

Climate Smart Farming
•CC ADAPTATION; CC impacts, strategies, adaptive
measures and practices
•FIVEF FINGERS; Water, soil, cropping, livestock and
natural resources
•FARMER INNOVATION SYSTEMS; experimentation,
impact
•FACILITATION AND LEARNING; processes and manuals
•COMMUNITIES OF PRACTICE; learning groups, forums,
networks….
•DECISION SUPPORT PROCESS; Model internet based and
facilitated process

FARMING SYSTEMFARMER SOCIO-ECONOMIC
BACKGROUND
RESOURCES TO MANAGE
SUGGESTED PRACTICES
CONSTRAINED BY
FARMER TYPOLOGY
AND ENVIRONMENT
RANKED PRACTICES
BASED ON FACILITATORRANKED PRACTICES
BASED ON FARMER
FARMER BASED
PRIORITIES
FACILITATOR
BASED PRIORITIES
PHYSICAL ENVIRONMENT
DSS PROCESS FLOW

Individual interviews; CCA Baseline –
Indicators for vulnerability
OUTCOMES
•Average age 49 years most with high school level
education
•Higher dependency ratio than national ave
•Ave household income- R3 992/ month
•Access to services- 89% electricity, water ~50% only
•Access to fencing and agricultural tools –89%
•80% belong to social organisations such as learning
groups VSLAs, gardening groups and co-ops
•67% of participants have household gardens only
and 55% of participants also have access to large
fields (0,1-.2ha). 61% of participants keep livestock.
Only 16% own cattle
•16% of households have direct access to traction
(animal and mechanical)
This sub-group of rural dwellers are more
organised and committed and better
resourced for production and adaptation than
the average rural person
Average monthly income per household
Male headed (39%)
R7 071
Female and male headed (33%)
R 2 068
Female headed (28%)
R 940
Household gardens are most common (67%),
followed by dryland cropping (38%), and cattle
ownership (16%)
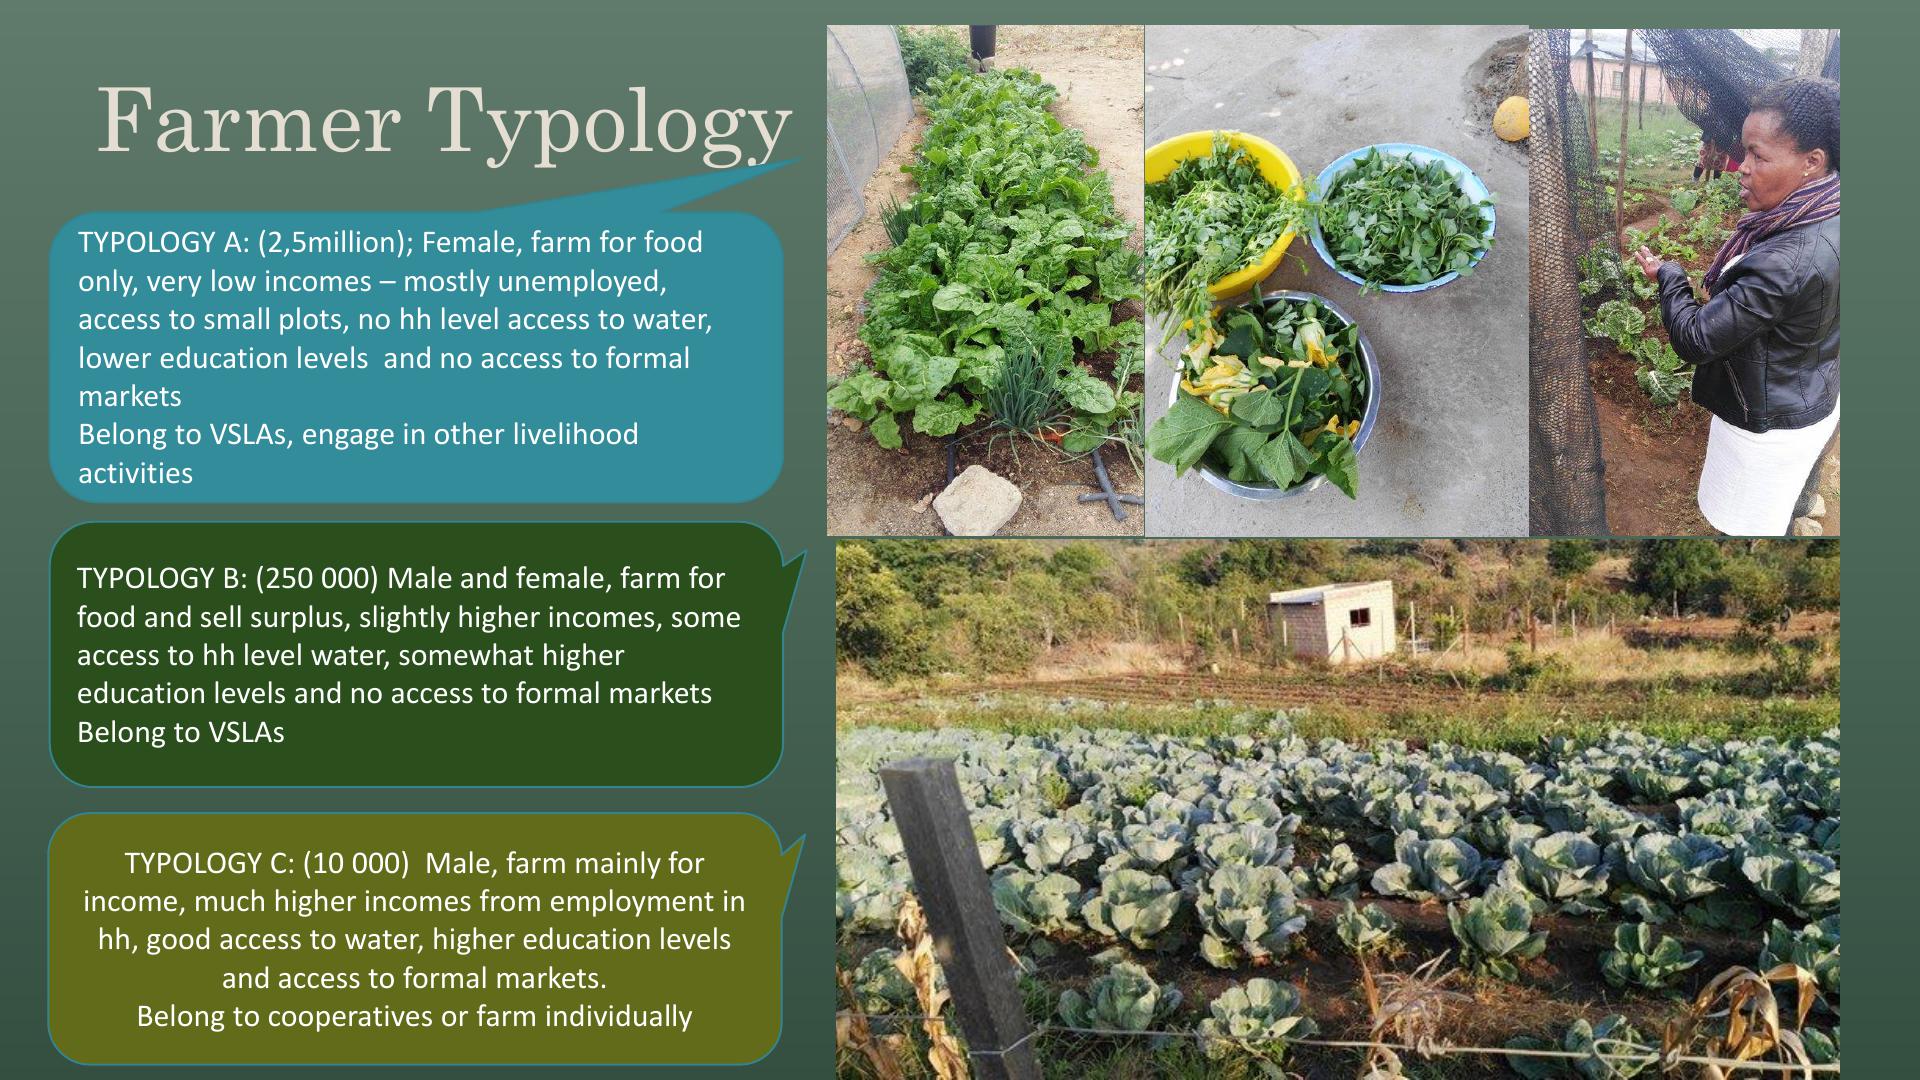
Farmer Typology
TYPOLOGY A: (2,5million); Female, farm for food
only, very low incomes –mostly unemployed,
access to small plots, no hh level access to water,
lowereducation levels and no access to formal
markets
Belong to VSLAs, engage in otherlivelihood
activities
TYPOLOGY C: (10 000) Male, farm mainly for
income, much higher incomes from employment in
hh, good access to water, higher education levels
and access to formal markets.
Belong to cooperatives or farm individually
TYPOLOGY B: (250 000) Male and female, farm for
food and sell surplus, slightly higher incomes, some
access to hh level water, somewhat higher
education levels and no access to formal markets
Belong to VSLAs

What we have
Communities of practices for stakeholder
involvement; sharing information, joint
operational activities
Relationships with Agribusiness for
appropriate technical support; infrastructure
and equipment
Microfinance options for smallholder
contributions and independence
•An appropriate methodology and process_
Innovation Systems
•For horizontal and vertical scaling
•For farmer level learning and implementation of
CSA
•For providing social platforms for financial
management
•For providing appropriate support for all types of
smallholders
•For monitoring (technical and social) and
evaluation including
•Scientific benchmarks for visual indicator

What we need
- Smart Subsidies
•Based on implementation of CSA
practices
•A set of criteria per activity type; 3-5
main criteria
•Individual or group, yearly subsidies
experimentation in CSA,
•Average 30% of cost value
•~R3 500/ participant/year
depending on scores
•Administered by non profit
organisations and institutions
Gardening
Field cropping
Livestock
Other
Improved organic
matter
(Mulching,
compost, manure…)
Minimal
disturbance
(percentage soil
disturbance)
Fodder
production
(types of crop,
types of
livestock)
Social
organisation
(learning
groups,
coops,..)
Improved water use
efficiency
( greywater
management, irrigation
scheduling, infiltration
run
-off)
Soil cover
(percentage soil
cover)
System
integration
(Use of
manure,
multifunctional
plants, …)
Collaborative
actions
(Work
groups, local
marketing, ..)
Diversification
(no and
type of different crops)
Crop
diversification
(no
and types of crops)
Grazing
management
Local savings
and loans
(
stokvels,
VSLAs,…)
Food security
(no of
crops no of times/week)
Improved soil
health
(carbon
sequestration, %
Organic carbon,
soil aggregates, …)
Water use
Income potential
(percentage of
hh
income)
Food security,
income
(no of
months food
provisioning, scale
of income)
Based broadly on
provision of ecosystem
services, not only
carbon sequestration
Paid for through carbon tax,
user pays, flagship and pilot
programmes from Government
Departments, Agribusiness